
Nacos Prometheus Grafana
 nacos系列文章第三篇,运维篇:Nacos prometheus grafana
Linux或者Windows平台,在字符操作命令界面如何监控Nacos、prometheus、grafana服务以及端口?
nacos系列文章第三篇,运维篇:Nacos prometheus grafana
Linux或者Windows平台,在字符操作命令界面如何监控Nacos、prometheus、grafana服务以及端口?
进入主题之前,先了解 Nacos prometheus grafana。

nacos 是什么?
一个更易于构建云原生应用的动态服务发现、配置管理和服务管理平台。
nacos 最新稳定版本更新到了 2.2.2 ,官方推荐使用 nacos 2.1.1 。
prometheus 是什么?
From metrics to insight
Power your metrics and alerting with the leading
open-source monitoring solution.
大意是,从监控到洞察力。利用领先的开源监控解决方案,让你的监控和警报发挥作用。
prometheus 最新稳定版本更新到了 2.4.3,你可以选择使用长期支持版本 2.3.7(LTS).
grafana 是什么?
Operational dashboards for your data here, there, or anywhere
大意是,在任何位置将你的数据以仪表板(控制面板)形式展现出来。
grafana 最新稳定版本更新到了 9.4.7 。
nacos系列文章第三篇:《运维篇:Nacos prometheus grafana》
当你再次看到这张流程图时,第三篇运维相关知识终于磨出来了:
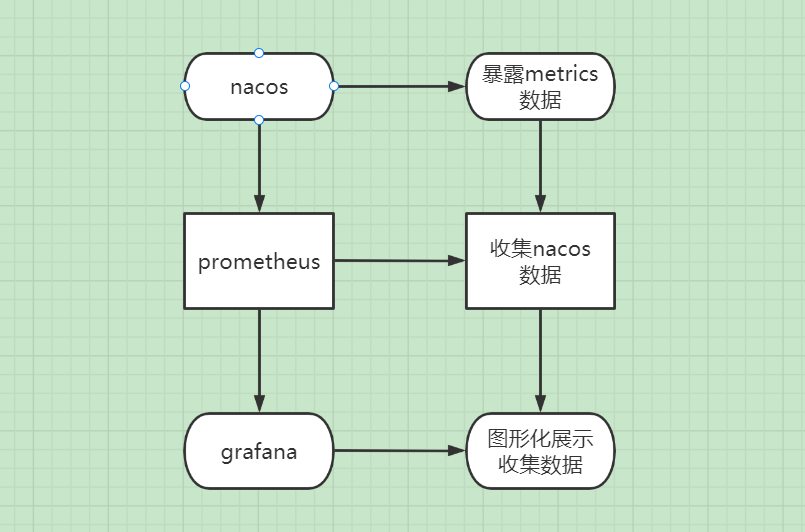
整体思路,个人nacos系列博文一共分为三篇:
- 基础篇:《MySQL数据库与Nacos搭建监控服务》,Nacos与MySQL基本介绍。
- 开发篇:《开发篇:springboot与微服务组件nacos》,从代码开始构建,集成微服务组件。
- 运维篇:《运维篇:nacos prometheus grafana》,服务监控篇,主要以Linux发行版为主。
不同的场景有不同的解决方案,按需(调研)适配spring、springboot、springcloud集成nacos。
运维篇:springboot与微服务组件nacos
此处主要以Linux(centos-stream-9)环境为主。如果非要在Windows平台使用,也是可以的。本人也在Windows平台测试过,同样可以正常运行。只是官方目前并不推荐在Windows平台使用,可能是还不够稳定吧。
个人在测试环境下,用过三个版本:
- nacos 2.0.3
- nacos 2.1.1
- nacos 2.2.0
目前,2.2.x 版本UI变化比较大,更加优美。
Linux服务器部署springboot项目
当你测试时,需要准备测试使用的环境。比如maven打包好的 jar 包,如何上传部署?
上传文件方法:
- 方式一:已知服务器用户名和密码(具有相关权限),可以使用 scp 命令上传。
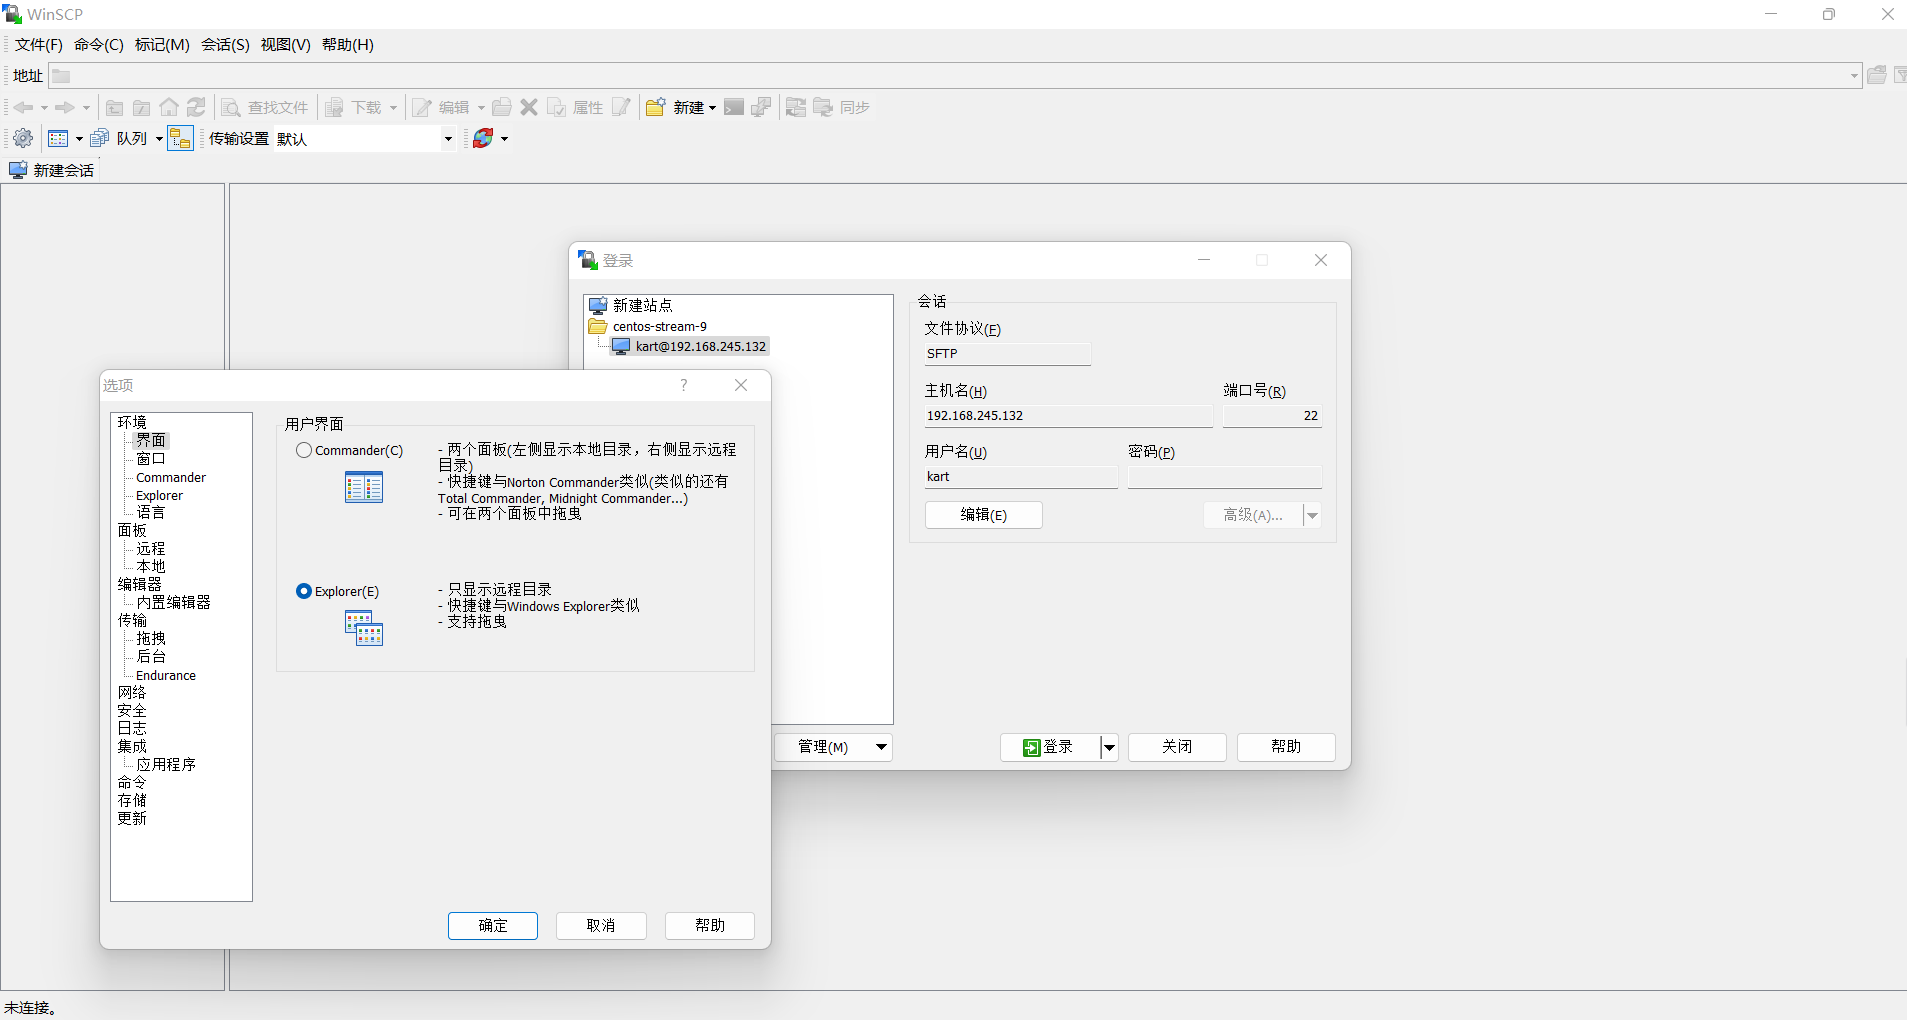
- 方式二:已知服务器用户名和密码(具有相关权限),可以使用工具 WinSCP、FileZilla等工具上传文件。
如下是WinSCP界面,两种方式:
- 左右方式,Windows窗口在左边,Linux服务器窗口在右边,支持拖拽和复制粘贴。
- 只显示远程目录形式,支持拖拽。
必备环境
- Linux(centos-stream-9)
- JDK17:支撑springboot服务启动
- Nacos 2.1.1 :监控发现springboot服务
解压JDK & 配置环境变量(如果仅仅为了测试可以不配置环境变量,采用指定服务路径形式)
RHEL体系shell环境变量调用顺序:
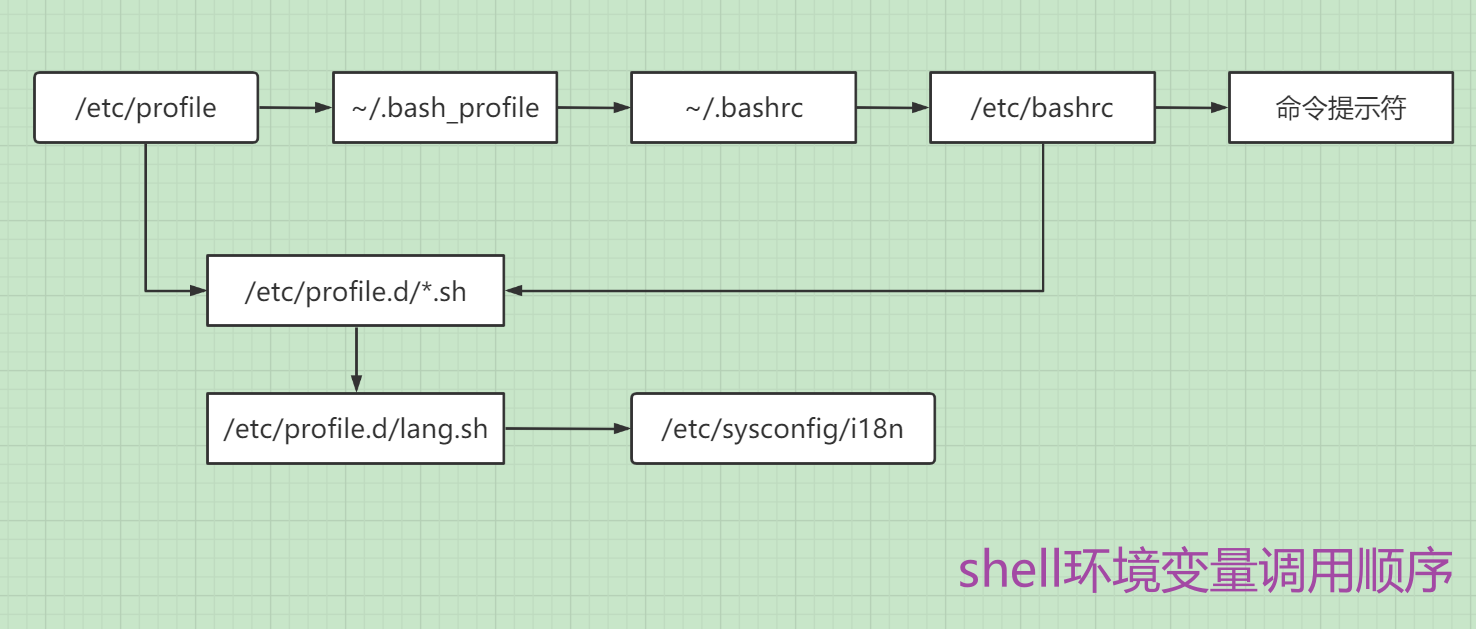
配置全局环境变量:vim /etc/profile,配置当前用户环境变量:vim .bash_profile 或者 .bashrc,加入配置全局变量我所列出的内容即可。什么时候配置全局用户,什么时候配置当前用户,各有各的应用场景。
比如配置当前用户环境变量,我只在 test 用户配置测试,就不给你 demo 用户进行测试,我们互不干扰。
比如配置全局用户环境变量,我既要 test 用户配置测试,我又要 demo 用户进行测试,还要在 root 用户下使用,我全都要。
如下分4步优化操作:
- 解压jdk :tar -zxvf jdk-17.0.4.1_linux-x64_bin.tar.gz
- 简化应用名称:mv jdk-17.0.4.1_linux-x64_bin jdk17
- 新建部署目录:mkdir -p /usr/java
- 指定部署目录:mv jdk17 /usr/java/
介绍配置全局环境变量:vim /etc/profile
JAVA_HOME=/usr/java/jdk17
CLASS_PATH=.:$JAVA_HOME/jre/lib/rt.jar:$JAVA_HOME/lib/dt.jar:$JAVA_HOME/lib/tools.jar
PATH=$PATH:$JAVA_HOME/bin
export JAVA_HOME CLASS_PATH PATH
执行 source 命令立即生效:
source /etc/profile
关于环境变量更多配置可参考个人公众号关于JDK17的介绍。
验证Java版本
配置了环境变量:
java -version
未配置环境变量:
/usr/java/jdk-17.0.4.1/bin/java -version
解压Nacos Server 并剪切到 /usr/local/ 目录
tar -zxvf nacos-server-2.1.1.tar.gz
mv nacos /usr/local/
启动nacos服务(非集群模式)
cd /usr/local/nacos/bin/
sh startup.sh -m standalone
新建测试目录
mkdir -p /opt/test /opt/sh
执行命令脱离终端运行,并输出日志到指定文件 /opt/test/springboot.log
[root@Centos9-Stream ~]# nohup /usr/java/jdk-17.0.4.1/bin/java -jar /opt/test/springboot-test-0.0.1-SNAPSHOT.jar >> /opt/test/springboot.log 2>&1 &
编辑脚本
vim /opt/sh/start_springboot_demo.sh
写入到脚本
#!/bin/bash
nohup /usr/java/jdk-17.0.4.1/bin/java -jar /opt/test/springboot-test-0.0.1-SNAPSHOT.jar  >> /opt/test/springboot.log 2>&1 &
curl命令测试接口
PS D:\work> curl http://192.168.245.132:8081/demo/getStu
{"code":0,"msg":"成功","data":{"id":"d5e52f71-67f0-499a-acf9-574ec14ffbe6","name":"梦梦","sex":"女","age":16}}
使用 cat 命令查看日志
cat /opt/test/springboot.log
使用 vim 查看
vim /opt/test/springboot.log
使用 tail 命令查看
tail -f /opt/test/springboot.log
tail -n 5 /opt/test/springboot.log
tail 参数:-n代表查看多少条日志信息,我只想查看最近的5条数据,使用 tail -n 5。
Springboot启动服务指定参数
注意:带参运行方式,开发或者测试时,可以运用上,便于调试。
参数一:--server.port=9999 代表指定服务端口运行,不添加则使用默认设置服务端口
参数二:-Dspring.profiles.active=prod 指定环境(eg:dev:开发环境、prod:生产环境、test:测试环境)
Windows平台
指定服务API端口:--server.port=9999
java -jar springboot-test-nacos.jar --server.port=9999
指定服务运行(生产)环境:-Dspring.profiles.active=prod
java -jar "-Dspring.profiles.active=prod" demo-0.0.1-SNAPSHOT.jar
Linux(RHEL系列)平台
采用默认形式指定运行(生产)环境,输出日志到 test.log 文件:
nouhup java -jar -Dspring.profiles.active=prod demo-0.0.1-SNAPSHOT.jar > test.log 2>&1 &
采用默认形式运行服务并指定服务端口,输出日志到 test.log 文件:
nouhup java -jar springboot-test-nacos.jar --server.port=9999 > test.log 2>&1 &
采用指定 jdk 路径,指定运行(生产)环境,输出日志到 test.log 文件:
nohup /usr/java/jdk-17.0.4.1/bin/java -jar /opt/test/springboot-test-0.0.1-SNAPSHOT.jar > /opt/test/springboot.log 2>&1 &
Linux & Win 监控运行中的服务
无论是 Linux 平台还是 Windows 平台,netstat 命令基本用法还是需要掌握的,对于开发、测试、运维都比较重要。
使用 netstat 监控如下服务:
- nacos:监控springboot服务
- prometheus:采集数据 ,个人使用的版本为 2.37.1
- grafana:图形化(仪表板)展示数据 ,个人使用版本为 9.3.0,目前9.3.x版本已经更新到 9.3.11
关于 nacos 服务部署以及设置MySQL数据源,此篇不再赘述。可以参考前两篇博文,有介绍,可在公众号内搜索到。
Linux (REHL系列) 平台查询运行中的nacos服务
netstat -tlunp | grep 8848;netstat -tlunp | grep 9848;netstat -tlunp | grep 9849
Windows 平台查询运行中的nacos服务
通过Windows terminal打开powershell或者CMD,使用netstat命令配合findstr查询nacos使用到的端口:
netstat -ano | findstr 8848;netstat -ano | findstr 9848;netstat -ano | findstr 9849
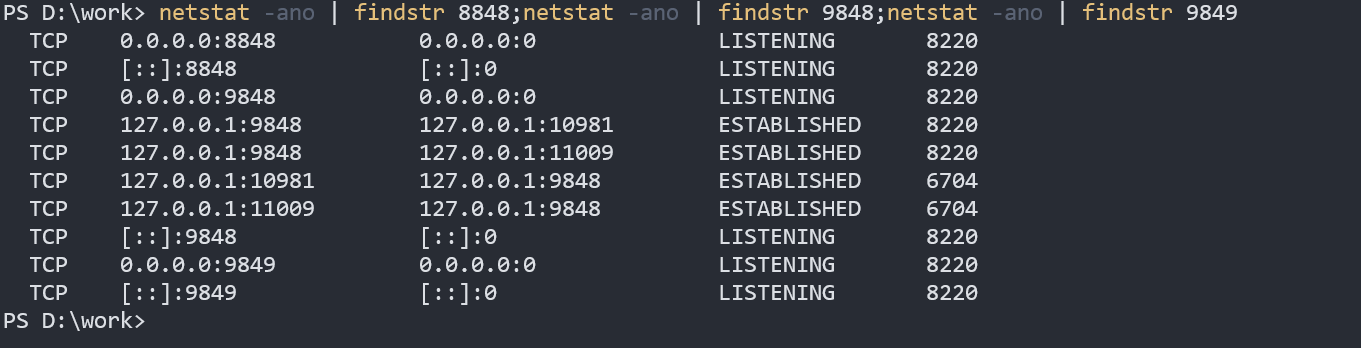
查阅官方文档,发现Nacos2.0版本相比1.X新增了gRPC的通信方式,因此需要增加2个端口。新增端口是在配置的主端口(server.port)基础上,进行一定偏移量自动生成。偏移量分别为:+1000,+1001,所以监控到端口多出了9848和9849。
友情提示:通常着重关注 ESTABLISHED ,表示已经确立联系。
通过查找到的PID,以图片上PID值8220为示例,使用命令tasklist去查找使用服务以及占用内存
tasklist | findstr 8220
java.exe                      8220 Console                    1    449,472 K
Linux (RHEL系列)查看运行中的springboot服务,已经引入微服务组件 nacos
[root@Centos9-Stream test]# netstat -tlunp | grep 8081; netstat -tlunp | grep 8082;netstat -tlunp | grep 8083;
tcp6       0      0 :::8081                 :::*                    LISTEN      2690/java
tcp6       0      0 :::8082                 :::*                    LISTEN      3104/java
tcp6       0      0 :::8083                 :::*                    LISTEN      3213/java
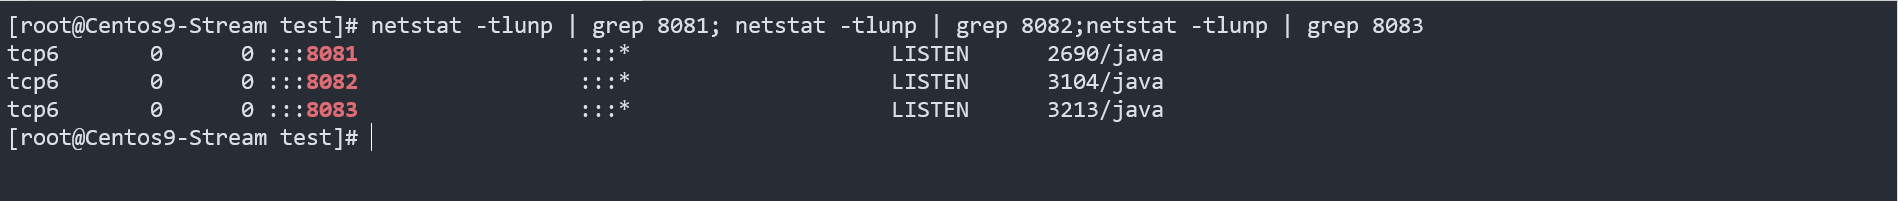
在Linux平台我习惯使用参数 -tlunp 去查询监听服务。
参数含义:
- -t:--tcp,显示监听tcp协议。
- -l:--listening ,用于展示监听服务的sockets。
- -u:--udp,显示监听udp协议。
- -n:--numeric,不解析服务(主机、端口、用户)名称。
- -p:--programs,显示使用了sockets 应用程序的PID号。
上面图片以及代码展示的tcp6(tcp协议),8081 表示ip绑定端口号,LISTEN 代表正在监听,2690/java 表示监听到java进程pid号是2690。通常我们比较关心的是端口(port),监听状态,服务名进程号。
更多参数使用,请查看帮助命令::
netstat -h
Windows 平台查看运行中的springboot服务
netstat -ano | findstr 8081;netstat -ano | findstr 8082;netstat -ano | findstr 8083
参数含义:
- -a: 显示所有连接和侦听端口。
- -n:以数字形式显示地址和端口号。
- -o:显示拥有的与每个连接关联的进程 ID。
更多参数使用,请查看帮助命令:
netstat help
RHEL 系列查看nacos、prometheus、grafana服务进程
ps命令监控服务三种方式:
- 使用 ps 命令参数 -aux:ps -aux | grep nacos| grep -v "grep"
- 使用 ps 命令参数 -ef:ps -ef | grep nacos| grep -v "grep"
- 使用 ps 命令参数 -le:ps -le | grep nacos| grep -v "grep"
如下使用参数 -aux 进行监控 nacos、prometheus、grafana 服务:
[root@Centos9-Stream prometheus-2.37.1]# ps -aux | grep nacos;ps -aux | grep prometheus;ps -aux | grep grafana
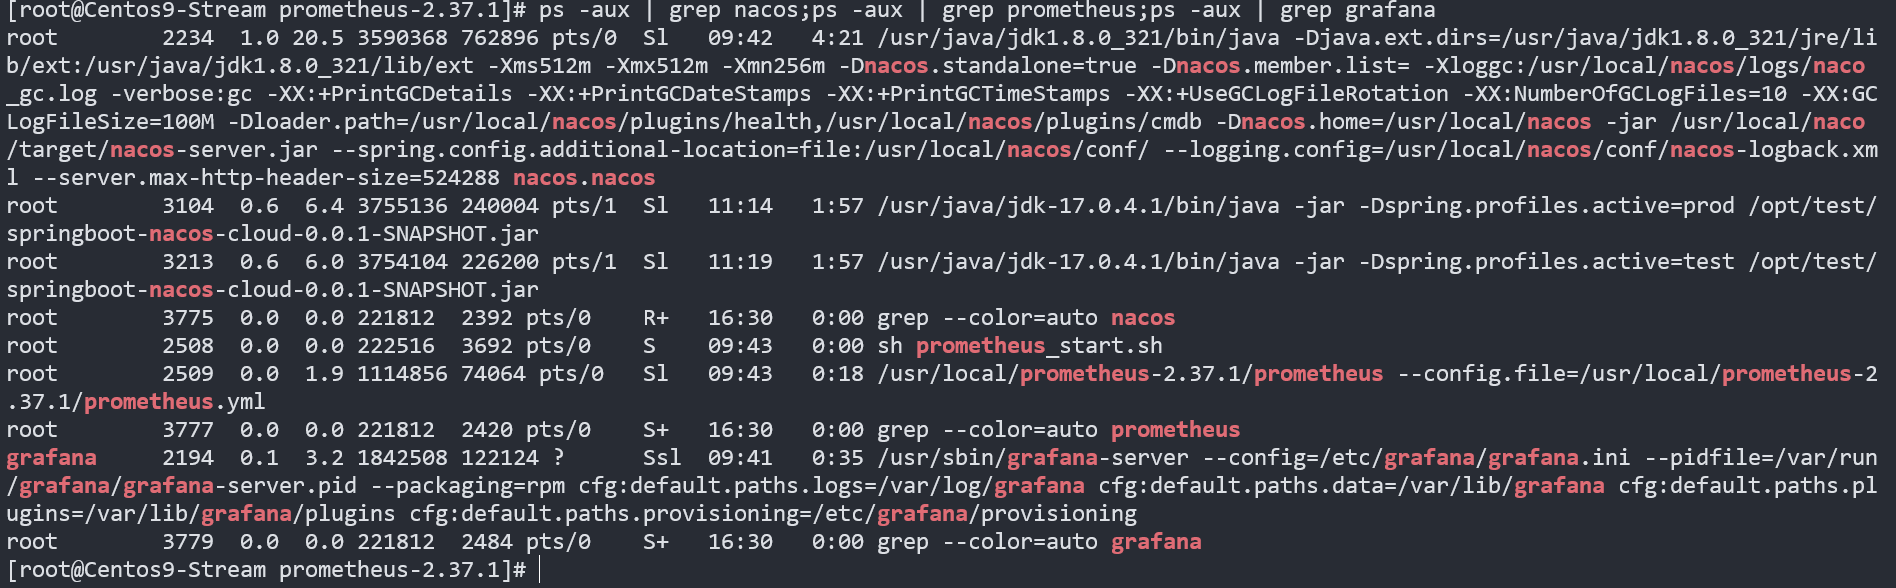
可以看到,监控服务命令将 nacos、prometheus、grafana 以红色字体标记出来了。将当前使用用户root、nacos 进程(pid)号2334、服务所在路径、配置文件指定路径等等展现在屏幕上。
这里教大家一个小技巧,如果你不想看到 grep --color=auto 这一行,可以通过 grep 取反命令过滤。
示例 grep 取反过滤:
ps -aux | grep nacos| grep -v "grep"
Windows 平台查看nacos、prometheus、grafana服务进程
tasklist | findstr nacos;tasklist | findstr prometheus;tasklist | findstr grafana;
RHEL 系列查看nacos、prometheus、grafana服务端口
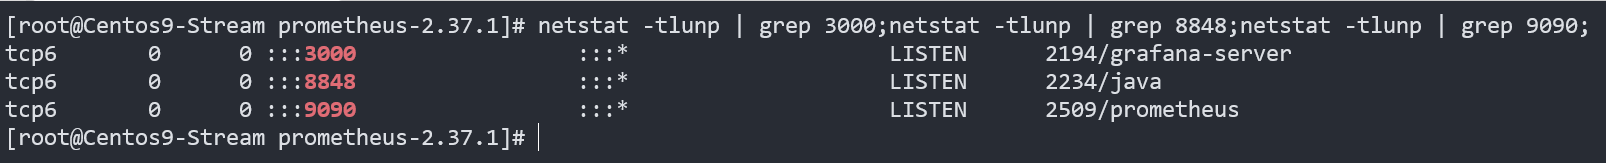
[root@Centos9-Stream prometheus-2.37.1]# netstat -tlunp | grep 3000;netstat -tlunp | grep 8848;netstat -tlunp | grep 9090
tcp6       0      0 :::3000                 :::*                    LISTEN      2194/grafana-server
tcp6       0      0 :::8848                 :::*                    LISTEN      2234/java
tcp6       0      0 :::9090                 :::*                    LISTEN      2509/prometheus
Windows 平台查看nacos、prometheus、grafana服务端口
netstat -ano | findstr 3000;netstat -ano | findstr 8848;netstat -ano | findstr 9090
Prometheus采集数据
简单科普
Prometheus是一个开源的系统监控和报警系统,它可以从多个来源收集数据,并对数据进行多维度的数据模型分析,可视化展现,及时报警。它已经加入到CNCF基金会,成为继k8s之后第二个在CNCF托管的项目。
Prometheus的基本原理是通过HTTP协议周期性抓取被监控组件的状态,任意组件只要提供对应的HTTP接口就可以接入监控。 不需要任何SDK或者其他的集成过程。 这样做非常适合做虚拟化环境监控系统,比如VM、Docker、Kubernetes等。 输出被监控组件信息的HTTP接口被叫做exporter。
Prometheus支持多种数据源,比如:
- 系统监控数据:例如cpu,内存,磁盘IO等。
- 网络数据:例如网络吞吐量,延迟等。
- 进程和线程数据:例如goroutines,processes,threads等。
- 存储数据:例如数据库的插入,更新,删除等。
Prometheus支持多种数据模型,例如:
- 指标模型:可以对系统的指标进行建模。
- 时间模型:可以对系统的时间序列数据进行建模。
- 事件模型:可以对系统的事件进行建模。
- 图模型:可以对系统的状态或流程进行可视化展现。
Prometheus有多种可视化图像界面,例如:
- Grafana:一个开源的、基于Web的可视化平台。
- VTiger:一个开源的、基于Web的仪表盘系统。
Prometheus还支持高可用,可以对数据做异地备份,联邦集群,部署多套prometheus,pushgateway上报数据等功能。总的来说,Prometheus是一个功能强大、易于使用的系统监控和报警系统,可以广泛应用于各种类型的系统监控和性能分析场景。
必备环境
- prometheus:采集数据
- nacos:监控发现服务
- JDK:支撑服务启动
prometheus 官方文档地址:https://prometheus.io/docs/prometheus/2.37/getting_started/
prometheus 下载地址:https://prometheus.io/download/
1、安装prometheus
请前往上面列出的下载地址准备好安装包,简化安装步骤如下。
tar -zxvf prometheus-2.37.1.linux-amd64.tar.gz
mv prometheus-2.37.1.linux-amd64 prometheus-2.37.1
mv prometheus-2.37.1 /usr/local/
2、启动prometheus服务
指定配置文件路径,执行prometheus脚本。示例:
/usr/local/prometheus-2.37.1/prometheus --config=/usr/local/prometheus-2.37.1/prometheus.yml
如果想脱离终端在后台运行,需要在行首加上 nohup 命令,在行尾加上& 符号。示例:
nohup /usr/local/prometheus-2.37.1/prometheus --config=/usr/local/prometheus-2.37.1/prometheus.yml &
参数含义:
- prometheus:普罗米修斯服务脚本。
- --config:用于指定普罗米修斯脚本 yml 格式配置文件。
3、修改配置文件,监控nacos暴露的metrics数据
说明:metrics_path和static_configs不要设置多个,否则检测会出现语法错误,提示已存在
# metrics_path defaults to '/metrics'
# scheme defaults to 'http'.
#监控nacos服务
    metrics_path: '/nacos/actuator/prometheus'
    static_configs:
#设置监控nacos远程服务地址
      - targets: ['192.168.245.132:8848']
4、检测配置文件
[root@Centos9-Stream nacos]# /usr/local/prometheus-2.37.1/promtool check config /usr/local/prometheus-2.37.1/prometheus.yml
Checking /usr/local/prometheus-2.37.1/prometheus.yml
 SUCCESS: /usr/local/prometheus-2.37.1/prometheus.yml is valid prometheus config file syntax
通过 kill 命令暴力停掉进程,再次启动 prometheus 服务:
netstat -tlunp | grep 9090
kill -9 进程号
nohup /usr/local/prometheus-2.37.1/prometheus --config=/usr/local/prometheus-2.37.1/prometheus.yml &
关于 netstat 命令上面有简单介绍过,不再赘述。
5、访问prometheus服务
prometheus 运行默认端口是9090:http://192.168.245.132:9090/
tips:需要将端口9090开放,或者通过防火墙管理工具firewalld临时关闭防火墙服务进行测试。
Linux(RHEL系列):
# 开放9090端口
firewall-cmd --zone=public --add-port=9090/tcp --permanent
firewall-cmd --reload

# 临时关闭
systemctl stop firewalld.service
6、查看prometheus监控status
依次选择status---> Targets---> show more
7、验证数据
搜索nacos_monitor,得到如下结果(截取部分):
nacos_monitor{instance="192.168.245.132:8848", job="prometheus", module="config", name="configCount"}
1
nacos_monitor{instance="192.168.245.132:8848", job="prometheus", module="config", name="dumpTask"}
0
nacos_monitor{instance="192.168.245.132:8848", job="prometheus", module="config", name="getConfig"}
9
...
nacos_monitor{instance="192.168.245.132:8848", job="prometheus", module="naming", name="ipCount"}
2
Grafana图形化展示数据
简单科普
Grafana是一款开源的数据可视化工具,它可以在Web浏览器中运行,提供了一个易于使用的界面,使用户可以轻松地创建各种类型的图表和仪表板。
Grafana拥有快速灵活的客户端图表,面板插件有许多不同方式的可视化指标和日志,官方库中具有丰富的仪表盘插件,比如热图、折线图、图表等多种展示方式,让我们复杂的数据展示的美观而优雅。它支持许多不同的时间序列数据(数据源)存储后端,每个数据源都有一个特定查询编辑器,官方支持以下数据源:Graphite、infloxdb、opensdb、prometheus、elasticsearch、cloudwatch。每个数据源的查询语言和功能明显不同,你可以将来自多个数据源的数据组合到一个仪表板上,但每个面板都要绑定到属于特定组织的特定数据源。它还支持警报功能,允许用户将规则附加到仪表板面板上,但目前只支持graph面板的报警。
总的来说,Grafana是一款功能强大的数据可视化工具,可以帮助用户轻松地创建漂亮的图表和仪表板,同时也支持各种数据源的组合和报警功能,是数据分析和可视化的必备工具之一。
必备环境
- grafana:图形化(仪表板)展示数据。
- prometheus:采集数据
- nacos:监控发现服务
- JDK:支撑服务启动
tips:初次登录,用户名:admin,密码:admin。
grafana下载地址:https://grafana.com/grafana/download
1、搭建grafana,图形化展示metrics数据
RHEL 系列快速安装grafana:
sudo yum install grafana
在RHEL7以及以上使用yum或者dnf命令安装完后,可以使用如下命令启动或者查看服务状态。
启动grafana服务:
systemctl start grafana-server.service
查看grafana服务:
systemctl status grafana-server.service
详细grafana安装指南,请参考官方文档
https://grafana.com/docs/grafana/v9.3/setup-grafana/installation/
Linux平台安装grafana服务
Standalone Linux Binaries(64 Bit)
oss版本获取地址,基于AGPLv3 开源协议。
wget https://dl.grafana.com/oss/release/grafana-9.3.0.linux-amd64.tar.gz
tar -zxvf grafana-9.3.0.linux-amd64.tar.gz
企业版enterprise获取地址
wget https://dl.grafana.com/enterprise/release/grafana-enterprise-9.3.0.linux-amd64.tar.gz
tar -zxvf grafana-enterprise-9.3.0.linux-amd64.tar.gz
Red Hat, CentOS, RHEL, and Fedora(64 Bit)
可以根据自己的需求选择 oss 版本或者 enterprise 企业版本。企业版本包含oss版本所有功能,同时也是免费使用,拥有更多插件功能。
wget https://dl.grafana.com/oss/release/grafana-9.3.0-1.x86_64.rpm
sudo yum install grafana-9.3.0-1.x86_64.rpm
Ubuntu and Debian(64 Bit)
sudo apt-get install -y adduser libfontconfig1
wget https://dl.grafana.com/oss/release/grafana_9.3.0_amd64.deb
sudo dpkg -i grafana_9.3.0_amd64.deb
grafana配置文件
如果使用yum或者dnf命令安装,安装后的grafana配置文件路径。主要配置文件在/etc/grafana/目录下,文件收集以及报警信息相关在/var/lib/grafana/目录下。
[root@Centos9-Stream local]# ls /etc/grafana/
grafana.ini  ldap.toml  provisioning
[root@Centos9-Stream local]# ls /var/lib/grafana/
alerting  csv  file-collections  grafana.db  png
[root@Centos9-Stream local]# du -sk -h /var/run/grafana/grafana-server.pid
4.0K    /var/run/grafana/grafana-server.pid
使用du命令查看grafana-server服务所占存储空间
[root@Centos9-Stream local]# du -sk -h /usr/sbin/grafana-*
4.0K    /usr/sbin/grafana-cli
102M    /usr/sbin/grafana-server
以上这些信息,在RHEL7以上环境中,你可以使用systemctl命令查看到所在路径
[root@Centos9-Stream local]# systemctl status grafana-server.service
● grafana-server.service - Grafana instance
	...
     CGroup: /system.slice/grafana-server.service
             └─2821 /usr/sbin/grafana-server --config=/etc/grafana/grafana.ini
             --pidfile=/var/run/grafana/grafana-server.pid
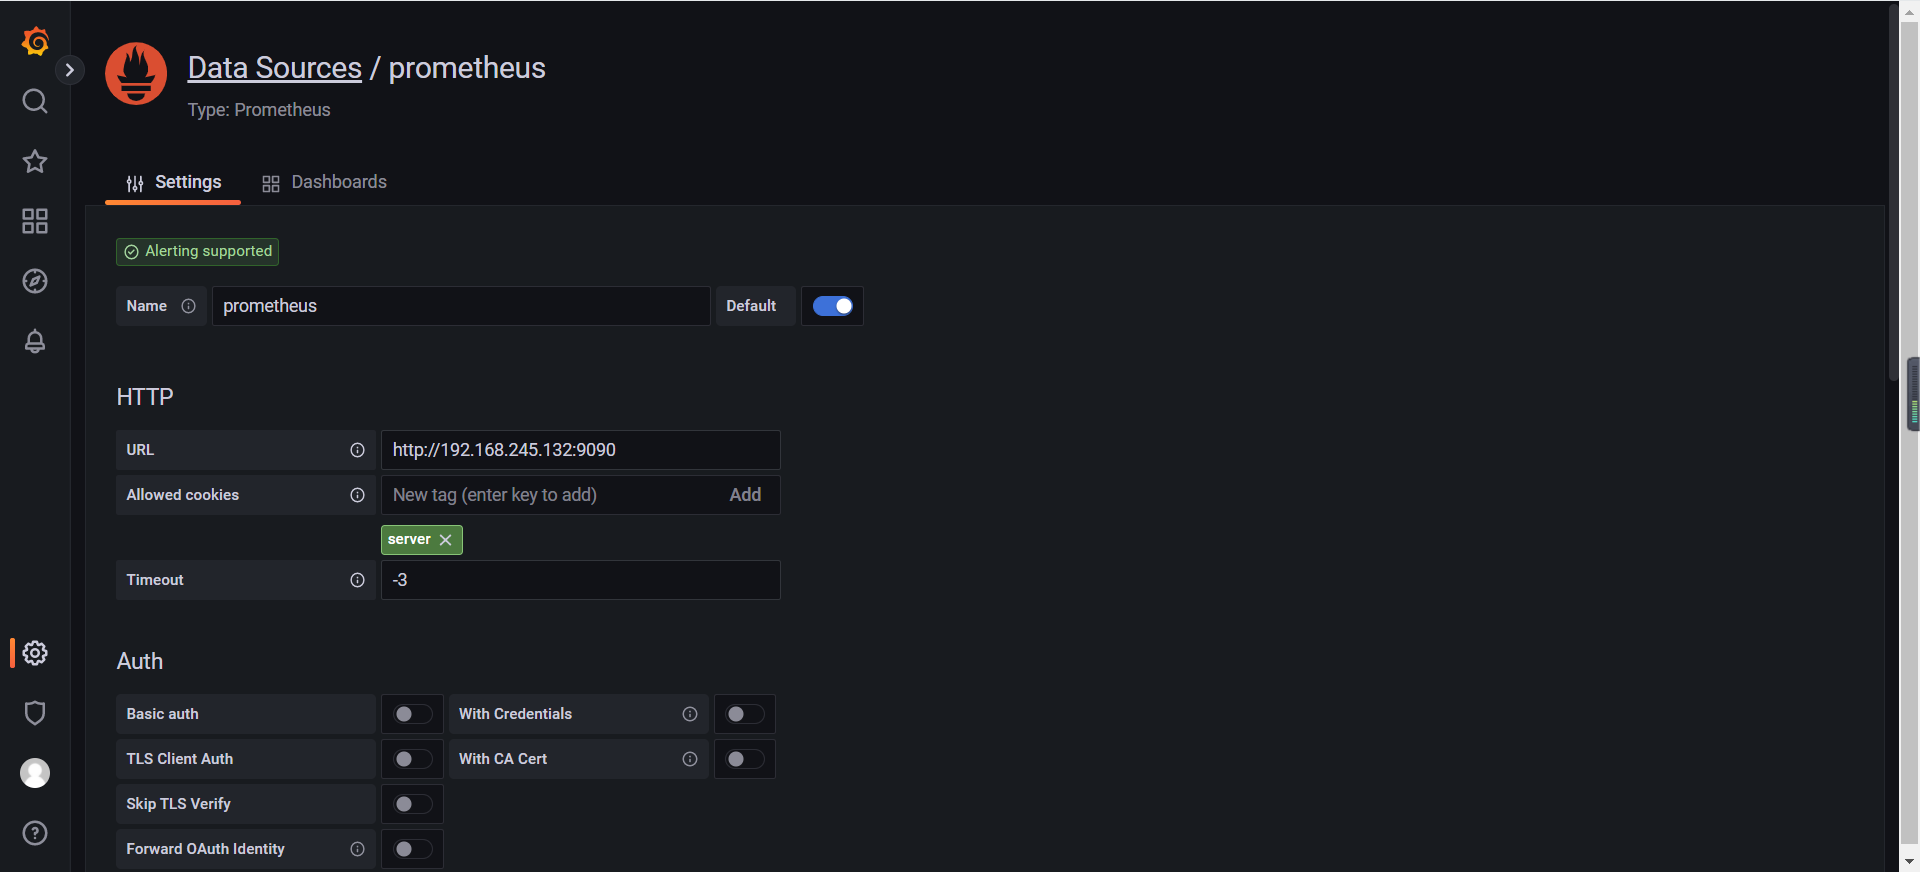
2、配置数据源prometheus
获取nacos json模板:https://github.com/nacos-group/nacos-template/blob/master/nacos-grafana.json
加入http地址:http://192.168.245.132:9090/
注意:将ip地址替换成你自己的。
如果遇到问题(注意排查导入json文件配置以及grafana数据源名称配置):
Failed to upgrade legacy queries Datasource prometheus was not found
检查配置json文件数据源名称:
"datasource": "prometheus",
"format": "none",
"gauge": {
   "maxValue": 100,
   "minValue": 0,
   "show": false,
   "thresholdLabels": false,
   "thresholdMarkers": true
可以看到默认配置的datasource是:prometheus
解决方法:修改默认数据源名称Prometheus为prometheus,注意匹配名称。
配置prometheus数据源
grafana运行默认端口是3000,访问:http://192.168.245.132:3000/
同样需要开放相应端口,参考上面介绍prometheus使用的方法。
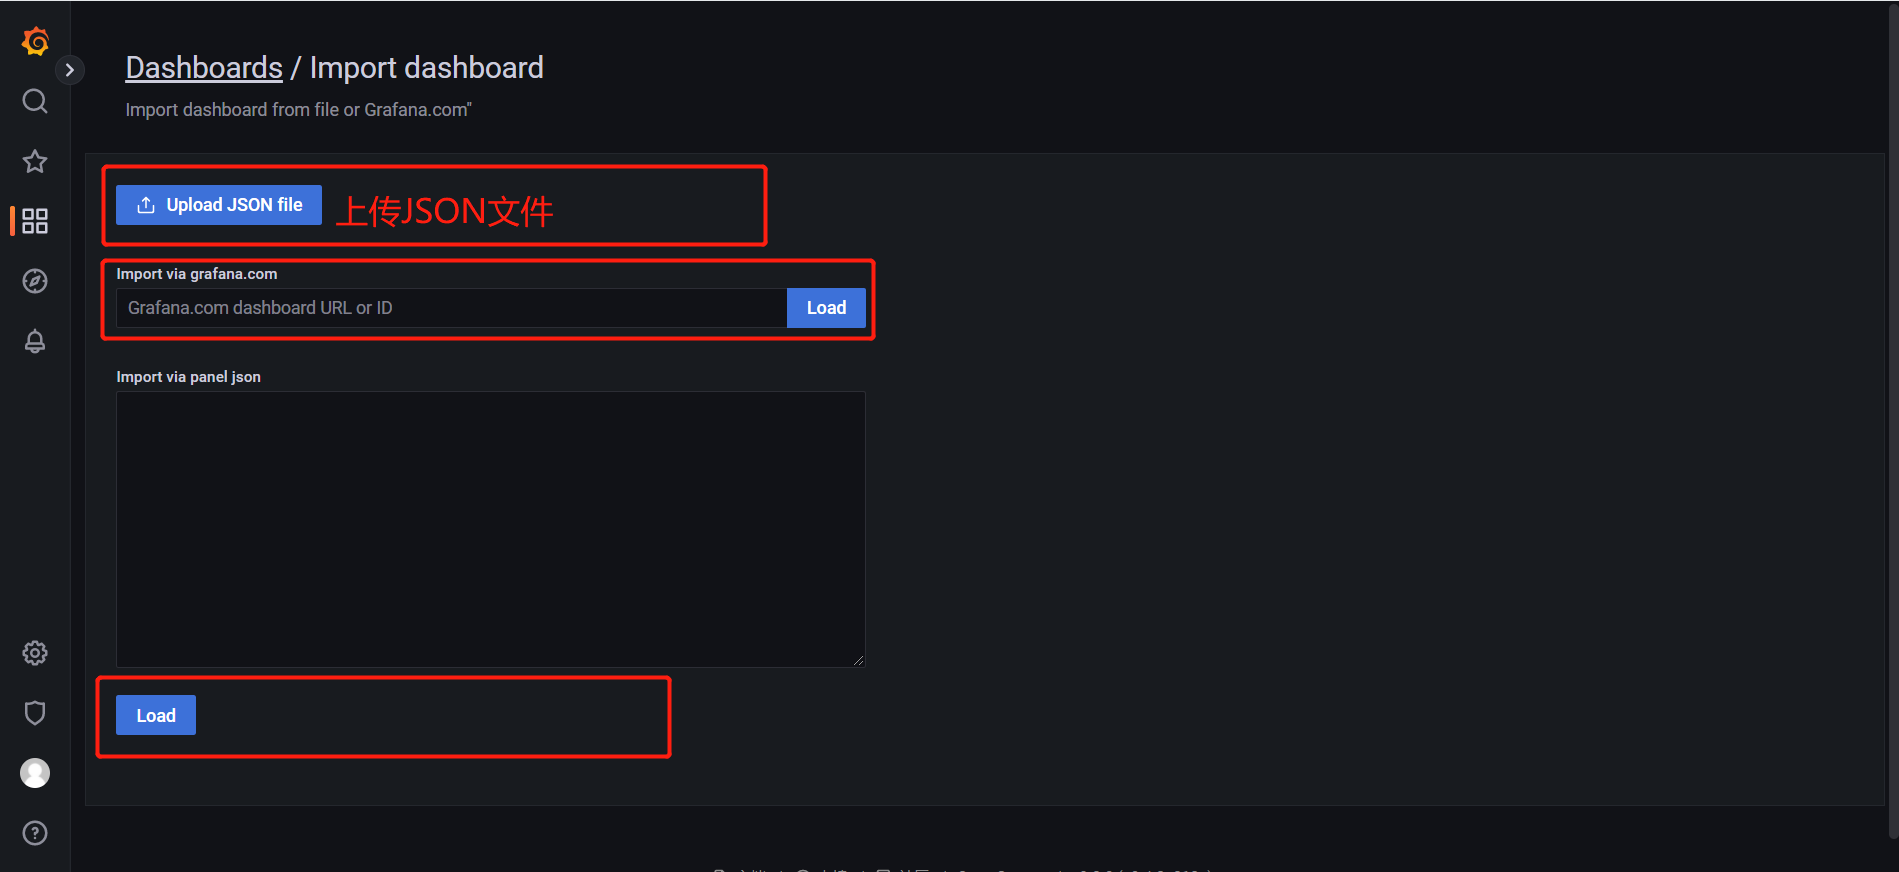
引入nacos json template
注意:熟悉的情况下,这个配置模板,可以根据自己的需求去修改,不一定要照搬,可以灵活运用。
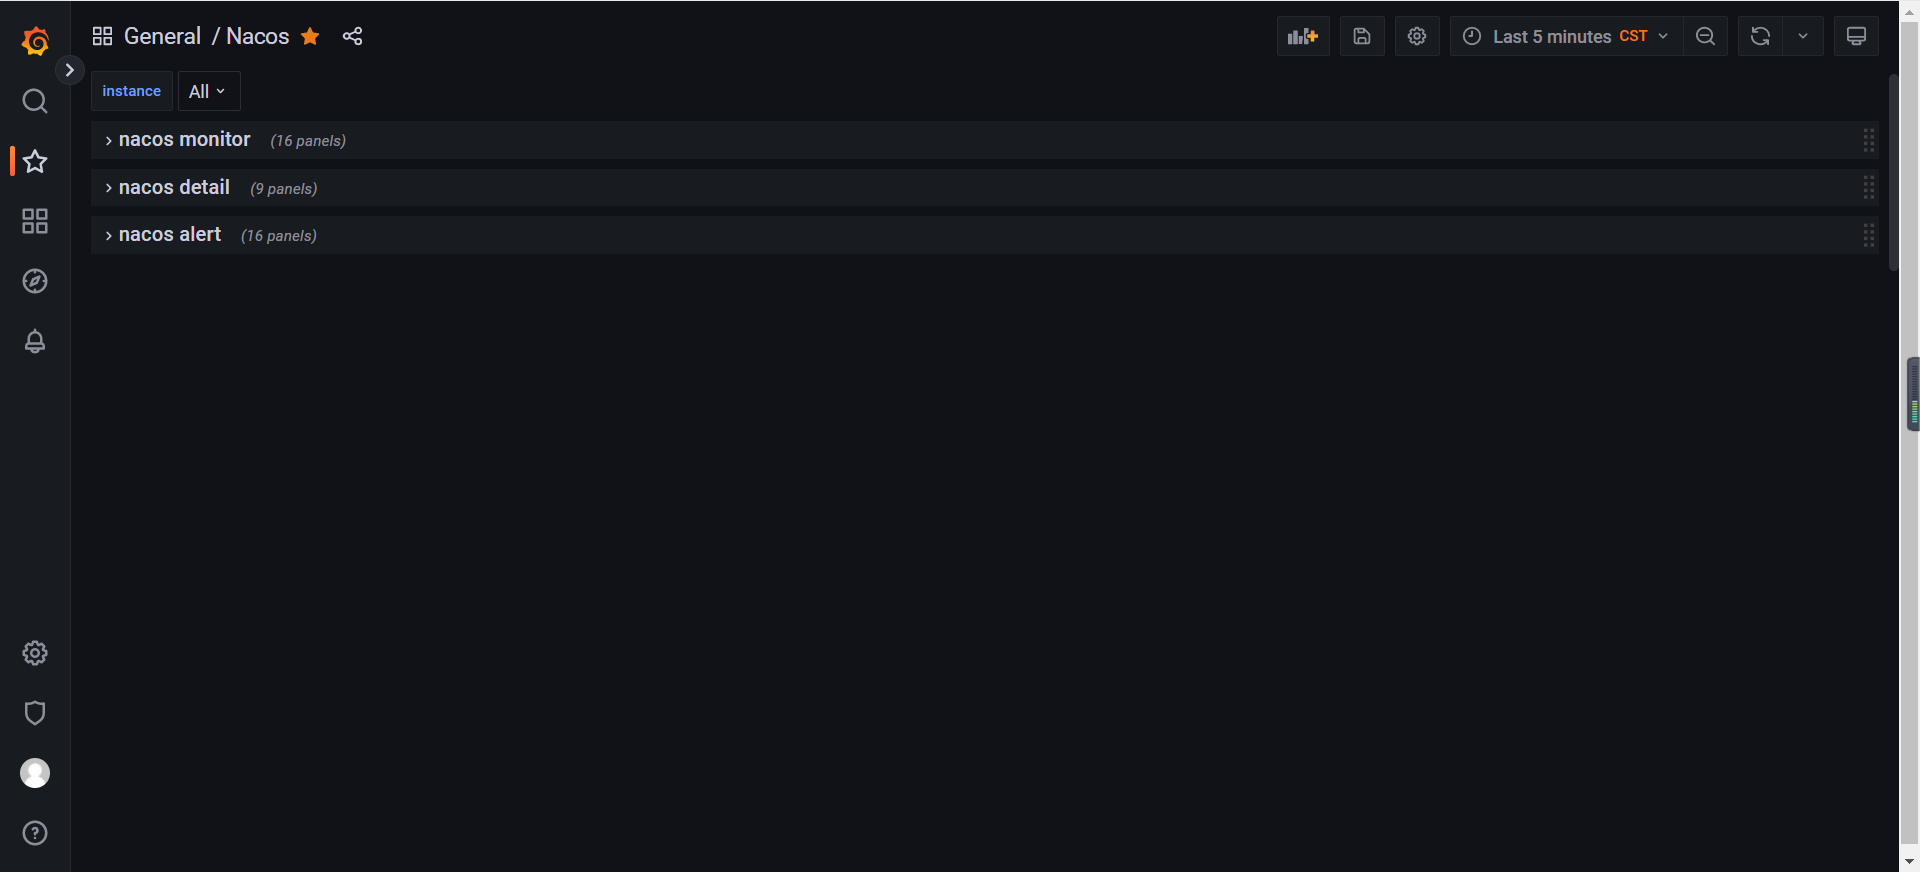
引入nacos json配置文件,看到如下三项代表配置成功
- nacos monitor:展示nacos服务监控信息,包含上线服务、IP个数、cpu、内存、线程负载等等。
- nacos detail:展示nacos服务详细信息。
- nacos alert:展示nacos服务报警相关信息。
nacos monitor 展示效果
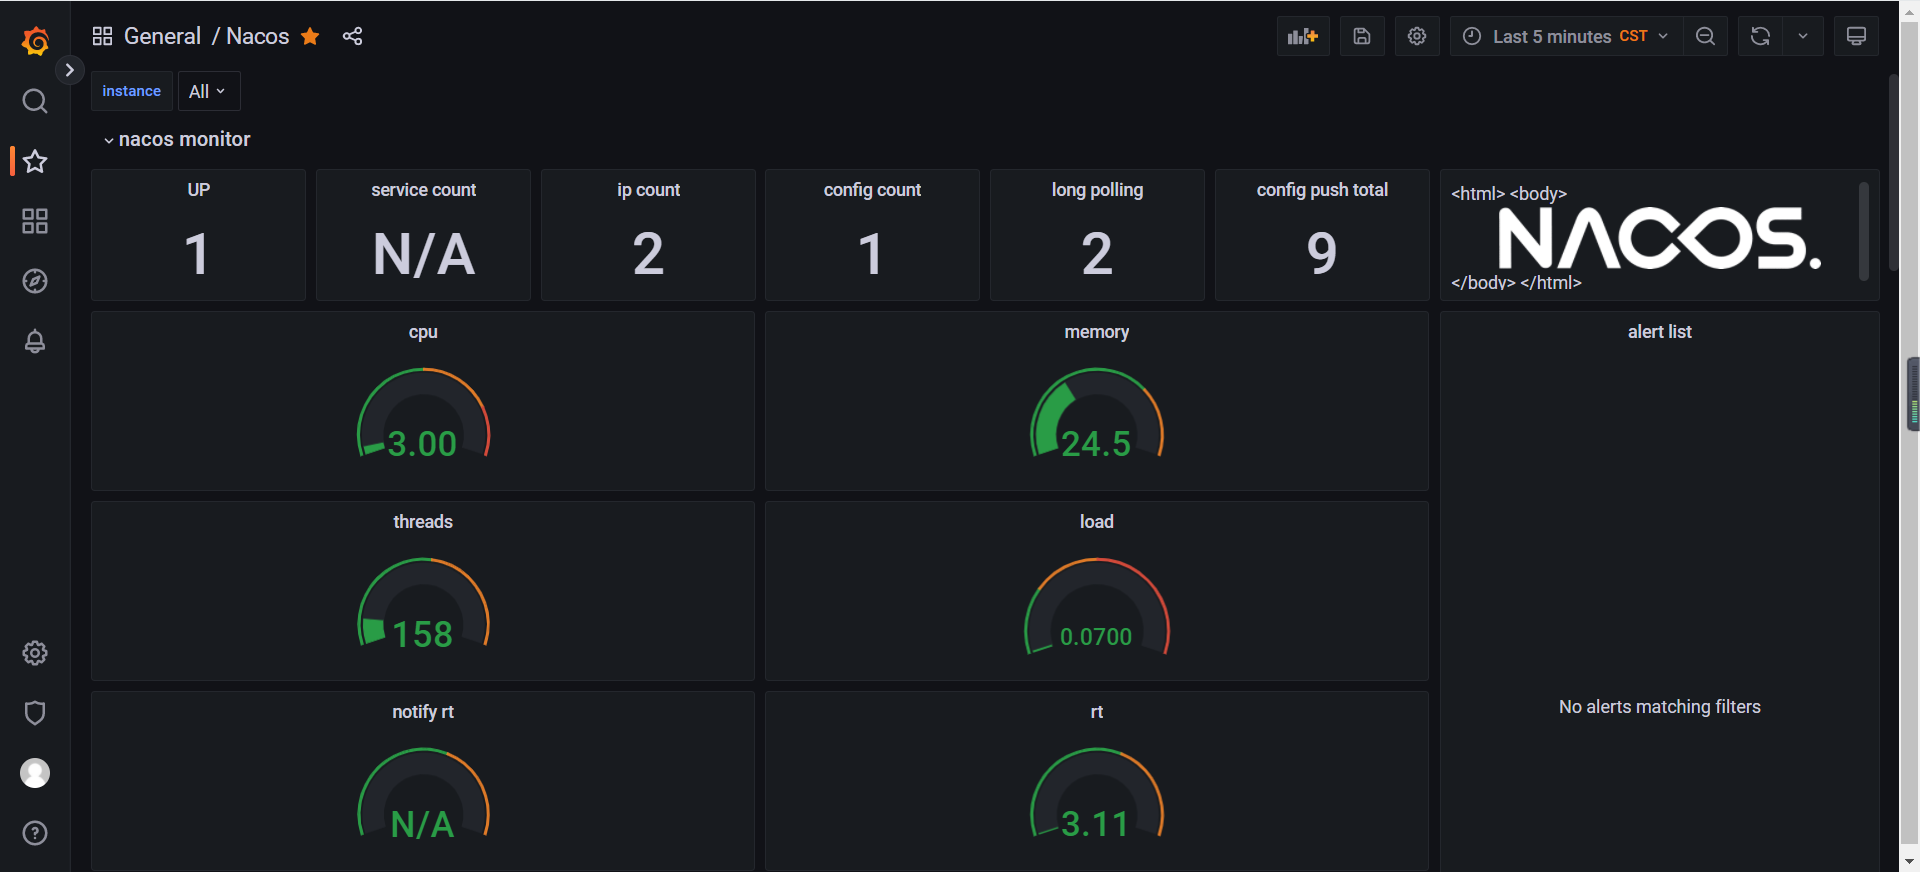
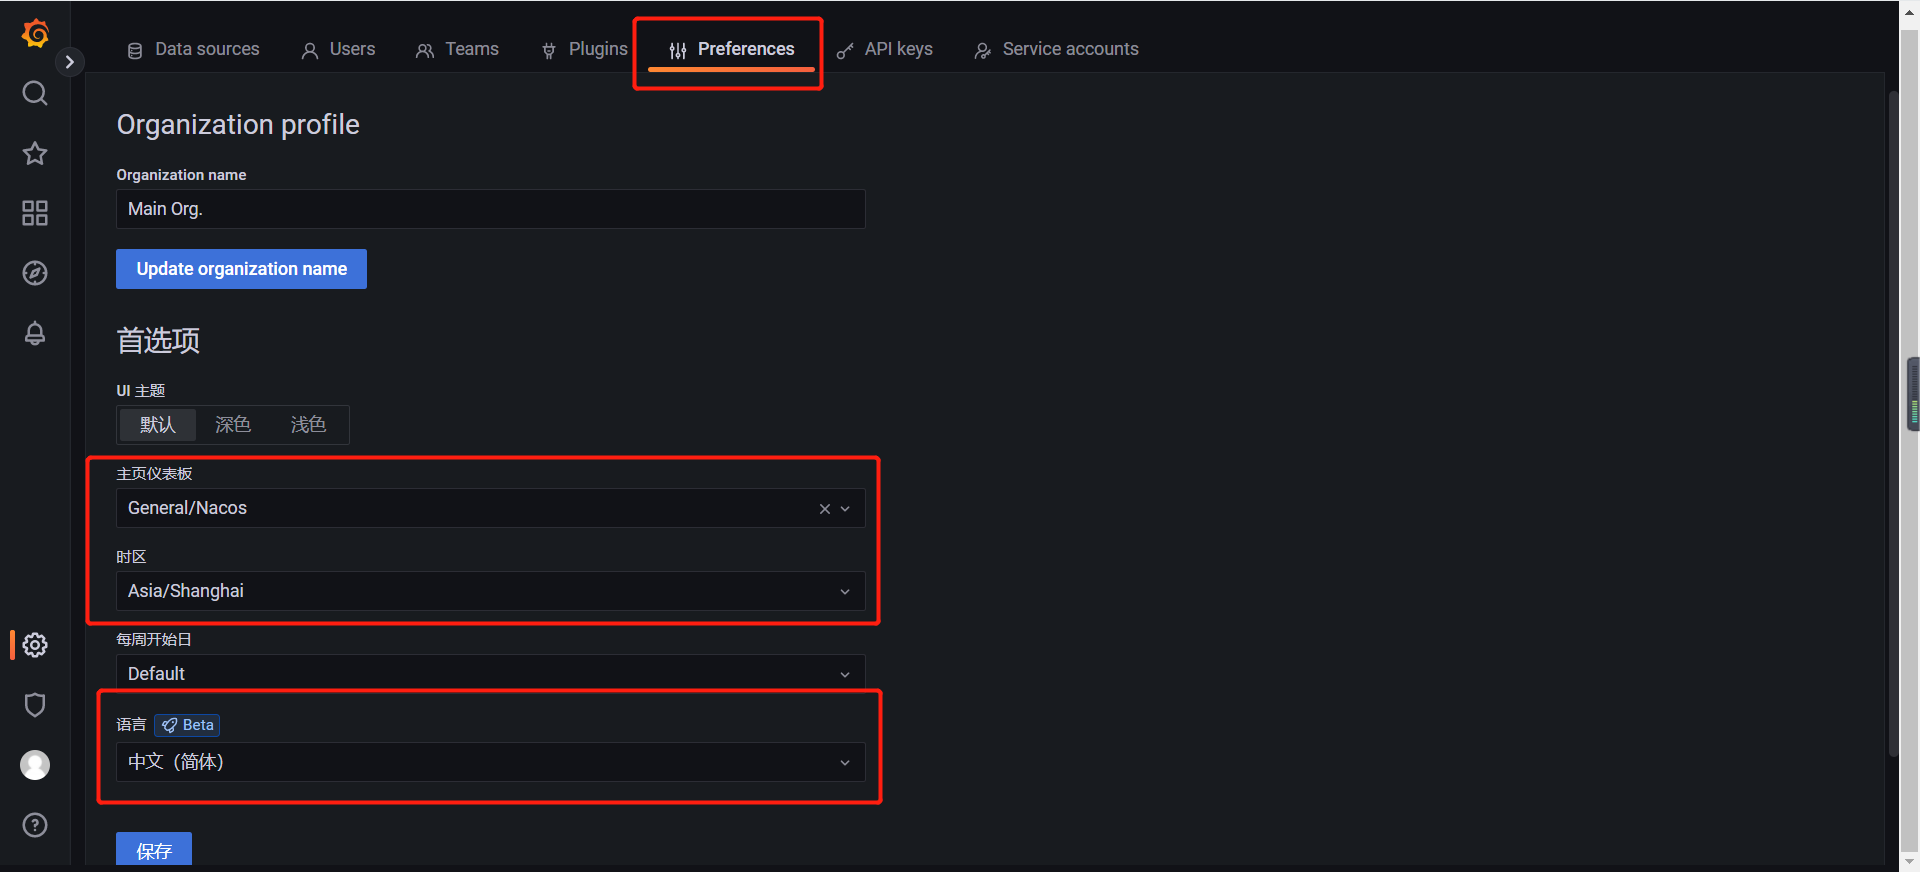
配置语言中文 & 时区
值得注意的是,在9.3.x之前还没实装设置语言这一项功能。
如果不出意外,配置完成,可以正常访问配置的nacos监控服务。
3、访问grafana服务
访问地址,默认端口3000,可以根据你的工作场景进行调整:http://192.168.245.132:3000/,如果在本地搭建,将ip替换为 127.0.0.1 或者 localhost。
如果在服务器搭建,将ip替换为你的解析域名或者远程ip地址。

如果想深入学习nacos,可以参考官方用户指南、运维指南和《Nacos架构&原理》。
《Nacos架构&原理》: https://developer.aliyun.com/ebook/36?spm=a2c6h.20345107.ebook-index.18.152c2984fsi5ST
到此为止,是本篇的全部内容。感谢你的阅读和建议,我们下期再见。
参考资料:
- nacos2.x官方文档:https://nacos.io/zh-cn/docs/v2/quickstart/quick-start.html
- prometheus官方文档:https://prometheus.io/docs/prometheus/2.37/getting_started/
- grafana官方文档:https://grafana.com/docs/grafana/latest/getting-started/
END----
静下心来,才发现原来不会的还有很多。
一分耕耘,一分收获。
多总结,你会发现,自己的知识宝库越来越丰富。