JMH即Java Microbenchmark Harness,是Java用来做基准测试的一个工具,该工具由OpenJDK提供并维护,测试结果可信度高。
相对于 Jmeter、ab ,它通过编写代码的方式进行压测,在特定场景下会更能评估某项性能。
本次通过使用JMH来压测Dubbo的性能(官方也是使用JMH压测)
只需要引用两个jar即可:
<dependency> <groupId>org.openjdk.jmh</groupId> <artifactId>jmh-core</artifactId> <version>1.29</version></dependency><dependency> <groupId>org.openjdk.jmh</groupId> <artifactId>jmh-generator-annprocess</artifactId> <version>1.29</version></dependency>通过一系列的注解即可使用JMH。
只能用在类上,有三个取值:
Scope.Thread:默认的State,每个测试线程分配一个实例;Scope.Benchmark:所有测试线程共享一个实例,用于测试有状态实例在多线程共享下的性能;Scope.Group:每个线程组共享一个实例;
时间单位,如毫秒 TimeUnit.MILLISECONDS、秒 TimeUnit.SECONDS
声明一个public方法为基准测试方法。该类下的所有被@Benchmark注解的方法都会执行。
相当于类的main方法
指定测试某个接口的指标,如吞吐量、平均执行时间,一般我都是选择 ALL
Mode有:
Throughput: 整体吞吐量,例如“1秒内可以执行多少次调用” (thrpt,参加第5点)
AverageTime: 调用的平均时间,例如“每次调用平均耗时xxx毫秒”。(avgt)
SampleTime: 随机取样,最后输出取样结果的分布,例如“99%的调用在xxx毫秒以内,99.99%的调用在xxx毫秒以内”(simple)
SingleShotTime: 以上模式都是默认一次 iteration 是 1s,唯有 SingleShotTime 是只运行一次。往往同时把 warmup 次数设为0,用于测试冷启动时的性能。(ss)
@BenchmarkMode({Mode.Throughput,Mode.All})public class StressTestProvider {}用于控制压测的次数
//测量2次,每次测量的持续时间为20秒@Measurement(iterations = 2, time = 20 , timeUnit = TimeUnit.SECONDS)预热,预热可以避免首次因为一些其他因素,如CPU波动、类加载耗时这些情况的影响。
@Warmup(iterations = 3, time = 1, timeUnit = TimeUnit.SECONDS)参数解释同上。
@Fork用于指定fork出多少个子进程来执行同一基准测试方法。
@Threads注解用于指定使用多少个线程来执行基准测试方法,如果使用@Threads指定线程数为2,那么每次测量都会创建两个线程来执行基准测试方法。
我这里的例子是压测dubbo,源码链接在文末
完整例子:
@BenchmarkMode({Mode.All})@Warmup(iterations = 3, time = 5, timeUnit = TimeUnit.SECONDS)//测量次数,每次测量的持续时间@Measurement(iterations = 3, time = 10, timeUnit = TimeUnit.SECONDS)@Threads(32)@Fork(1)@State(Scope.Benchmark)@OutputTimeUnit(TimeUnit.SECONDS)@Slf4jpublic class StressTestProvider { private final AnnotationConfigApplicationContext annotationConfigApplicationContext; private final StressTestController stressTestController; public StressTestProvider() { annotationConfigApplicationContext = new AnnotationConfigApplicationContext(AnnotationConfig.class); annotationConfigApplicationContext.start(); stressTestController = annotationConfigApplicationContext.getBean("stressTestController", StressTestController.class); } @TearDown public void close() throws IOException { annotationConfigApplicationContext.close(); } @Benchmark public void string1k() { stressTestController.string1k(); } @Benchmark public void string100k() { stressTestController.string100k(); } public static void main(String[] args) throws RunnerException { log.info("测试开始"); Options opt = new OptionsBuilder() .include(StressTestProvider.class.getSimpleName()) //可以通过注解注入// .warmupIterations(3)// .warmupTime(TimeValue.seconds(10)) //报告输出 .result("result.json") //报告格式 .resultFormat(ResultFormatType.JSON).build(); new Runner(opt).run(); }}有两种运行的方式,一般采用打成jar这种。
如上,只需要 配置Options,运行main方法即可,注意要使用 run模式启动,不要使用debug模式启动。
否则会报错:
transport error 202: connect failed: Connection refused ERROR有时候需要放在服务器上运行,就需要打成一个jar,需要使用单独的jar打包插件:
<build> <plugins> <plugin> <groupId>org.apache.maven.plugins</groupId> <artifactId>maven-shade-plugin</artifactId> <version>2.2</version> <executions> <execution> <phase>package</phase> <goals> <goal>shade</goal> </goals> <configuration> <finalName>jmh-demo</finalName> <transformers> <transformer implementation="org.apache.maven.plugins.shade.resource.ManifestResourceTransformer"> <mainClass>org.openjdk.jmh.Main</mainClass> </transformer> <transformer implementation="org.apache.maven.plugins.shade.resource.ServicesResourceTransformer"/> </transformers> </configuration> </execution> </executions> </plugin> </plugins></build>如果不想要这种打包方式,打成jar的时候一定要声明main方法入口对应的类,也就是上面StressTestProvider
还有就是,因为我的是springboot项目,我测试了一下想同时打包springboot和 jmh:
但是运行 jhm-demo.jar 发现报错:not match main class,还是老老实实通过 profile 节点打包吧。
打完包后,通过以下命令即可运行:
java -jar jmh-demo.jar -rf json -rff result.json-rf json 是输出 json的格式
-rff /data/result.json 是输出文件位置和名称
执行后,会生成一个汇总结果:
Result "com.dubbo.benchmark.StressTestProvider.string1k": N = 3 mean = 0.016 ±(99.9%) 0.022 s/op Histogram, s/op: [0.014, 0.014) = 0 [0.014, 0.015) = 0 [0.015, 0.015) = 0 [0.015, 0.015) = 1 [0.015, 0.015) = 1 [0.015, 0.016) = 0 [0.016, 0.016) = 0 [0.016, 0.016) = 0 [0.016, 0.016) = 0 [0.016, 0.017) = 0 [0.017, 0.017) = 0 [0.017, 0.017) = 0 [0.017, 0.017) = 1 [0.017, 0.018) = 0 [0.018, 0.018) = 0 [0.018, 0.018) = 0 Percentiles, s/op: p(0.0000) = 0.015 s/op p(50.0000) = 0.015 s/op p(90.0000) = 0.017 s/op p(95.0000) = 0.017 s/op p(99.0000) = 0.017 s/op p(99.9000) = 0.017 s/op p(99.9900) = 0.017 s/op p(99.9990) = 0.017 s/op p(99.9999) = 0.017 s/op p(100.0000) = 0.017 s/op# 第36行# Run complete. Total time: 00:05:12Benchmark Mode Cnt Score Error UnitsStressTestProvider.string100k thrpt 3 759.794 ± 66.300 ops/sStressTestProvider.string1k thrpt 3 6798.005 ± 6992.093 ops/sStressTestProvider.string100k avgt 3 0.042 ± 0.002 s/opStressTestProvider.string1k avgt 3 0.005 ± 0.012 s/opStressTestProvider.string100k sample 22982 0.042 ± 0.001 s/opStressTestProvider.string100k:string100k·p0.00 sample 0.017 s/opStressTestProvider.string100k:string100k·p0.50 sample 0.041 s/opStressTestProvider.string100k:string100k·p0.90 sample 0.048 s/opStressTestProvider.string100k:string100k·p0.95 sample 0.050 s/opStressTestProvider.string100k:string100k·p0.99 sample 0.058 s/opStressTestProvider.string100k:string100k·p0.999 sample 0.075 s/opStressTestProvider.string100k:string100k·p0.9999 sample 0.088 s/opStressTestProvider.string100k:string100k·p1.00 sample 0.092 s/opStressTestProvider.string1k sample 186906 0.005 ± 0.001 s/opStressTestProvider.string1k:string1k·p0.00 sample 0.001 s/opStressTestProvider.string1k:string1k·p0.50 sample 0.005 s/opStressTestProvider.string1k:string1k·p0.90 sample 0.007 s/opStressTestProvider.string1k:string1k·p0.95 sample 0.008 s/opStressTestProvider.string1k:string1k·p0.99 sample 0.011 s/opStressTestProvider.string1k:string1k·p0.999 sample 0.030 s/opStressTestProvider.string1k:string1k·p0.9999 sample 0.035 s/opStressTestProvider.string1k:string1k·p1.00 sample 0.038 s/opStressTestProvider.string100k ss 3 0.030 ± 0.181 s/opStressTestProvider.string1k ss 3 0.016 ± 0.022 s/op Benchmark result is saved to result.json简单分析一下:
只需要从第36行开始看,我这里一共压测了2个方法
这一列表示测试的名称,也就是 @BenchmarkMode你选择的测试类型,源码在此:
public enum Mode { /** * <p>Throughput: operations per unit of time.</p> */ Throughput("thrpt", "Throughput, ops/time"), /** * <p>Average time: average time per per operation.</p> * */ AverageTime("avgt", "Average time, time/op"), /** * <p>Sample time: samples the time for each operation.</p> * */ SampleTime("sample", "Sampling time"), /** * <p>Single shot time: measures the time for a single operation.</p> * */ SingleShotTime("ss", "Single shot invocation time"),thrpt:吞吐量,也可以理解为tps、ops
avgt:每次请求的平均耗时
sample:请求样本数量,这次压测一共发了多少个请求
ss:除去冷启动,一共执行了多少轮
单位
误差
如果你配置了输出文件,比如我上面的 resul.json ,但是你打开是看不懂的,可以借助两个网站把文件上传进行分析:
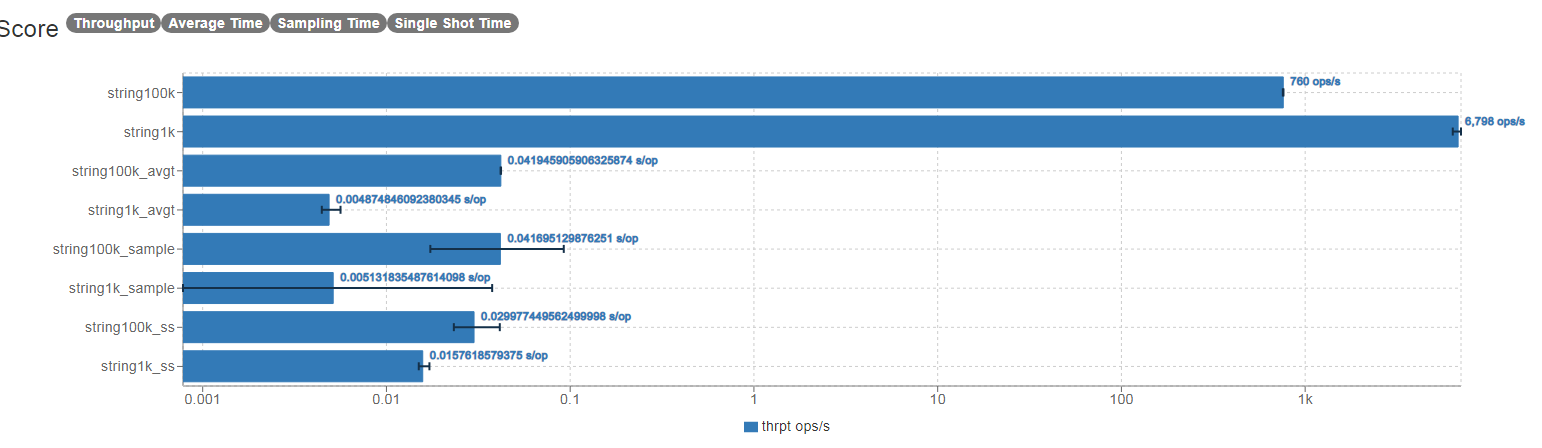
以上对dubbo进行了分别传输1k和100k的数据压测。
provider机器:
2核4gCentOS release 6.4 (Final)model name : QEMU Virtual CPU version 2.5+stepping : 3cpu MHz : 2099.998cache size : 4096 KBJVM:
jdk1.8-server -Xmx2g -Xms2g -XX:+UseG1GC dubbo:
版本:2.7.3序列化:hessian2使用默认dubbo线程数压测参数:
32并发结果:
| 1k | 100k | |
|---|---|---|
| TPS | 6700 | 760 |
| RTT | 95% 8ms | 95% 50ms |
| AVGTime/OP | 5ms | 42ms |
| OOM | 无 | 无 |
对比了 jmeter、Apache-Benmark(ab)、jmh 这三个压测工具,个人比较推荐使用jmh,原因有:
灵感参考:
压测dubbo的源码已上传到github:https://github.com/DogerRain/dubbo-samples-test
Java资源分享:Java学习路线思维导图+Java学习视频+简历模板+Java电子书