通过docker命令查看容器级别的日志
docker ps --->containerid
docker logs containerid --->查看容器的日志情况
kubectl logs -f <pod-name> -c <container-name>
kubectl describe pod springboot-demo-68b89b96b6-sl8bq
journalctl -u kubelet
前面的方式可以很好的查看日志,但是也有问题,如果发生服务器故障,日志无法得到很好的保存,这时就必须要做到持久化保存及方便人员查看,最好有UI页面查看,这时就到了接下来要说的事了
github:https://github.com/AliyunContainerService/log-pilot
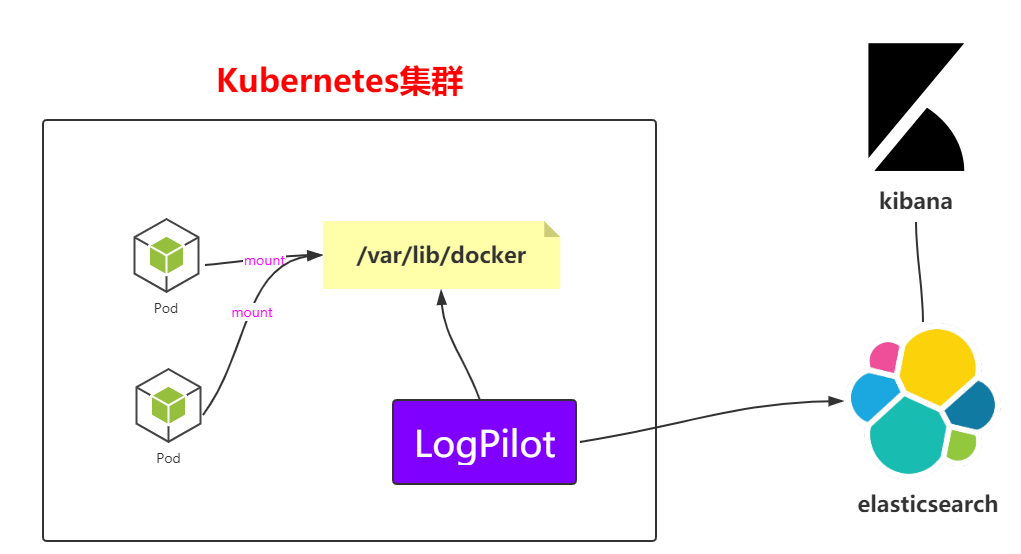
上面是一个架构图,看一眼就很明白采集方式了,就不过多解析了,接下来就直接在k8s中部署这个架构
---apiVersion: extensions/v1beta1kind: DaemonSetmetadata: name: log-pilot namespace: kube-system labels: k8s-app: log-pilot kubernetes.io/cluster-service: "true"spec: template: metadata: labels: k8s-app: log-es kubernetes.io/cluster-service: "true" version: v1.22 spec: tolerations: - key: node-role.kubernetes.io/master effect: NoSchedule containers: - name: log-pilot image: registry.cn-hangzhou.aliyuncs.com/log-monitor/log-pilot:0.9-filebeat #这块要上网拉取,最好是自己拉取然后放到自己的镜像仓库中 resources: limits: memory: 200Mi requests: cpu: 100m memory: 200Mi env: - name: "FILEBEAT_OUTPUT" value: "elasticsearch" - name: "ELASTICSEARCH_HOST" value: "elasticsearch-api" - name: "ELASTICSEARCH_PORT" value: "9200" - name: "ELASTICSEARCH_USER" value: "elastic" - name: "ELASTICSEARCH_PASSWORD" value: "changeme" volumeMounts: - name: sock mountPath: /var/run/docker.sock - name: root mountPath: /host readOnly: true - name: varlib mountPath: /var/lib/filebeat - name: varlog mountPath: /var/log/filebeat securityContext: capabilities: add: - SYS_ADMIN terminationGracePeriodSeconds: 30 volumes: - name: sock hostPath: path: /var/run/docker.sock - name: root hostPath: path: / - name: varlib hostPath: path: /var/lib/filebeat type: DirectoryOrCreate - name: varlog hostPath: path: /var/log/filebeat type: DirectoryOrCreate
(2)启动脚本
kubectl apply -f log-pilot.yaml
(3)查看pod和daemonset的信息
kubectl get pods -n kube-system
kubectl get pods -n kube-system -o wide | grep log
kubectl get ds -n kube-system
(1)创建elasticsearch.yaml文件
---apiVersion: v1kind: Servicemetadata: name: elasticsearch-api namespace: kube-system labels: name: elasticsearchspec: selector: app: es ports: - name: transport port: 9200 protocol: TCP---apiVersion: v1kind: Servicemetadata: name: elasticsearch-discovery namespace: kube-system labels: name: elasticsearchspec: selector: app: es ports: - name: transport port: 9300 protocol: TCP---apiVersion: apps/v1beta1kind: StatefulSetmetadata: name: elasticsearch namespace: kube-system labels: kubernetes.io/cluster-service: "true"spec: replicas: 3 serviceName: "elasticsearch-service" selector: matchLabels: app: es template: metadata: labels: app: es spec: tolerations: - effect: NoSchedule key: node-role.kubernetes.io/master initContainers: - name: init-sysctl image: busybox:1.27 command: - sysctl - -w - vm.max_map_count=262144 securityContext: privileged: true containers: - name: elasticsearch image: registry.cn-hangzhou.aliyuncs.com/log-monitor/elasticsearch:v5.5.1 #这里面也一样自己拉取包在自己的私服 ports: - containerPort: 9200 protocol: TCP - containerPort: 9300 protocol: TCP securityContext: capabilities: add: - IPC_LOCK - SYS_RESOURCE resources: limits: memory: 4000Mi requests: cpu: 100m memory: 2000Mi env: - name: "http.host" value: "0.0.0.0" - name: "network.host" value: "_eth0_" - name: "cluster.name" value: "docker-cluster" - name: "bootstrap.memory_lock" value: "false" - name: "discovery.zen.ping.unicast.hosts" value: "elasticsearch-discovery" - name: "discovery.zen.ping.unicast.hosts.resolve_timeout" value: "10s" - name: "discovery.zen.ping_timeout" value: "6s" - name: "discovery.zen.minimum_master_nodes" value: "2" - name: "discovery.zen.fd.ping_interval" value: "2s" - name: "discovery.zen.no_master_block" value: "write" - name: "gateway.expected_nodes" value: "2" - name: "gateway.expected_master_nodes" value: "1" - name: "transport.tcp.connect_timeout" value: "60s" - name: "ES_JAVA_OPTS" value: "-Xms2g -Xmx2g" livenessProbe: tcpSocket: port: transport initialDelaySeconds: 20 periodSeconds: 10 volumeMounts: - name: es-data mountPath: /data terminationGracePeriodSeconds: 30 volumes: - name: es-data hostPath: path: /es-data
(2)启动脚本文件
kubectl apply -f elasticsearch.yaml
kubectl get pods -n kube-systemkubectl get pods -n kube-system -o wide | grep ela(3)查看kube-system下的svc
kubectl get svc -n kube-systemelasticsearch-api ClusterIP 10.106.65.2 <none> 9200/TCP
elasticsearch-discovery ClusterIP 10.101.117.180 <none> 9300/TCP
kube-dns ClusterIP 10.96.0.10 <none>
(4)查看kube-system下的statefulset
kubectl get statefulset -n kube-systemNAME READY AGE
elasticsearch 3/3 106s
---# DeploymentapiVersion: apps/v1beta1kind: Deploymentmetadata: name: kibana namespace: kube-system labels: component: kibanaspec: replicas: 1 selector: matchLabels: component: kibana template: metadata: labels: component: kibana spec: containers: - name: kibana image: registry.cn-hangzhou.aliyuncs.com/log-monitor/kibana:v5.5.1 #这块一样,自己拉取保存私服 env: - name: CLUSTER_NAME value: docker-cluster - name: ELASTICSEARCH_URL value: http://elasticsearch-api:9200/ resources: limits: cpu: 1000m requests: cpu: 100m ports: - containerPort: 5601 name: http---# ServiceapiVersion: v1kind: Servicemetadata: name: kibana namespace: kube-system labels: component: kibanaspec: selector: component: kibana ports: - name: http port: 80 targetPort: http---# IngressapiVersion: extensions/v1beta1kind: Ingressmetadata: name: kibana namespace: kube-systemspec: rules: - host: log.k8s.ghy.com http: paths: - path: / backend: serviceName: kibana servicePort: 80
(2)执行脚本启动
kubectl apply -f kibana.yaml
(3)查看pod和deployment的信息
kubectl get pods -n kube-system | grep ki
kubectl get deploy -n kube-system
(4)配置Ingress需要的域名,打开windows上的hosts文件
# 注意这边是worker01的IP
121.41.10.126 kibana.ghy.com
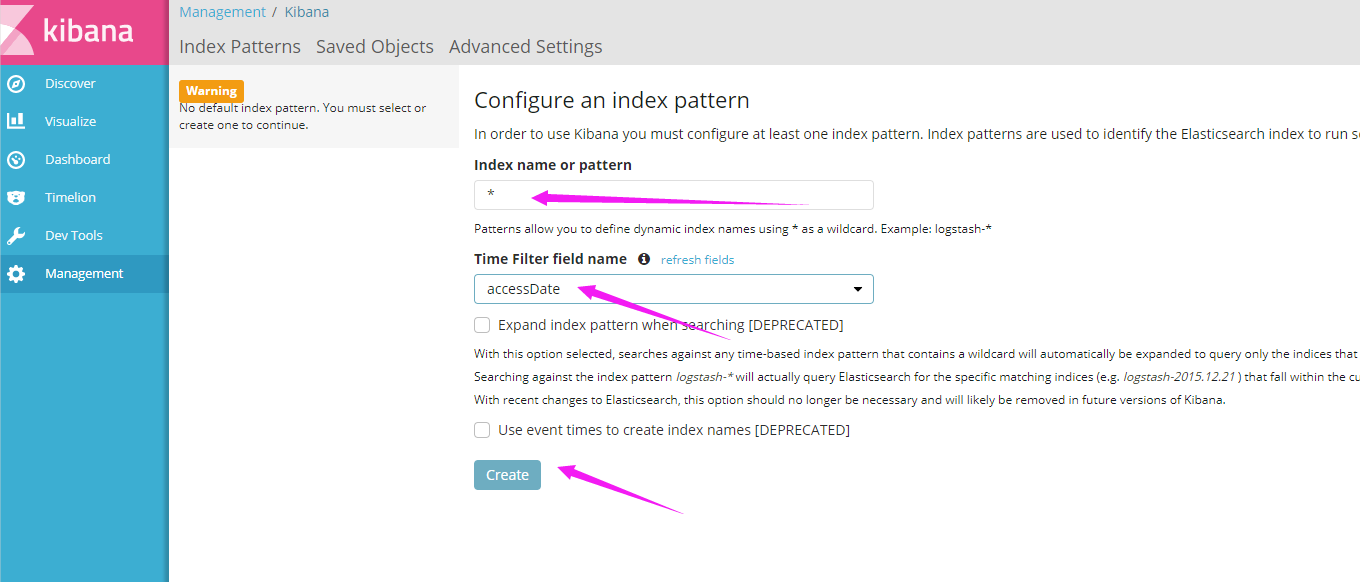
(5)在windows访问
日志经过上面的步骤就有了,接下来就是搞监控了,例如监控CPU,系统资源等等;而Prometheus是K8S官方推荐使用的方式,接下来就看看这玩意。
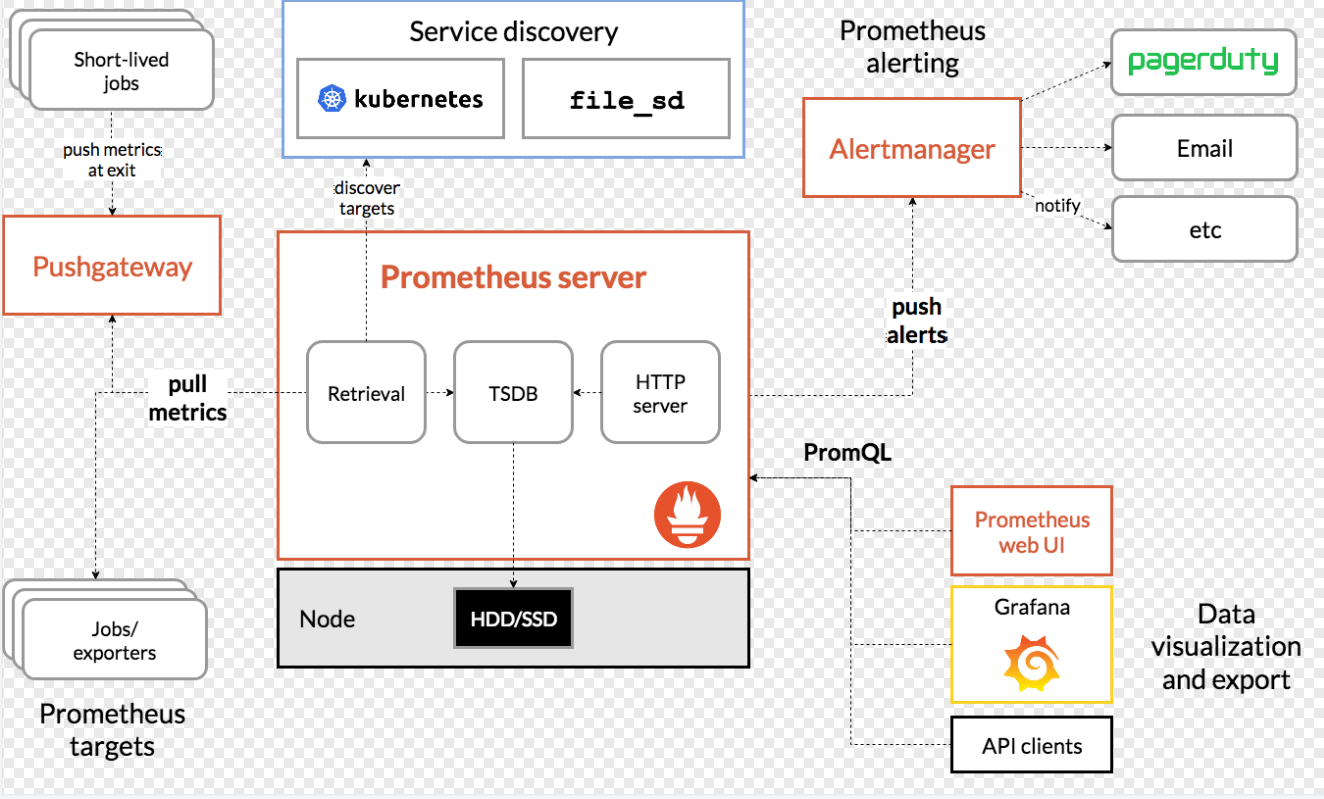
(1)在master上创建prometheus目录然后创建下面这些yaml文件
apiVersion: v1kind: Namespacemetadata: name: ns-monitor labels: name: ns-monitor
kind: DaemonSetapiVersion: apps/v1beta2metadata: labels: app: node-exporter name: node-exporter namespace: ns-monitorspec: revisionHistoryLimit: 10 selector: matchLabels: app: node-exporter template: metadata: labels: app: node-exporter spec: containers: - name: node-exporter image: prom/node-exporter:v0.16.0 ports: - containerPort: 9100 protocol: TCP name: http hostNetwork: true hostPID: true tolerations: - effect: NoSchedule operator: Exists---kind: ServiceapiVersion: v1metadata: labels: app: node-exporter name: node-exporter-service namespace: ns-monitorspec: ports: - name: http port: 9100 nodePort: 31672 protocol: TCP type: NodePort selector: app: node-exporter
---apiVersion: rbac.authorization.k8s.io/v1beta1kind: ClusterRolemetadata: name: prometheusrules: - apiGroups: [""] # "" indicates the core API group resources: - nodes - nodes/proxy - services - endpoints - pods verbs: - get - watch - list - apiGroups: - extensions resources: - ingresses verbs: - get - watch - list - nonResourceURLs: ["/metrics"] verbs: - get---apiVersion: v1kind: ServiceAccountmetadata: name: prometheus namespace: ns-monitor labels: app: prometheus---apiVersion: rbac.authorization.k8s.io/v1beta1kind: ClusterRoleBindingmetadata: name: prometheussubjects: - kind: ServiceAccount name: prometheus namespace: ns-monitorroleRef: kind: ClusterRole name: prometheus apiGroup: rbac.authorization.k8s.io---apiVersion: v1kind: ConfigMapmetadata: name: prometheus-conf namespace: ns-monitor labels: app: prometheusdata: prometheus.yml: |- # my global config global: scrape_interval: 15s # Set the scrape interval to every 15 seconds. Default is every 1 minute. evaluation_interval: 15s # Evaluate rules every 15 seconds. The default is every 1 minute. # scrape_timeout is set to the global default (10s). # Alertmanager configuration alerting: alertmanagers: - static_configs: - targets: # - alertmanager:9093 # Load rules once and periodically evaluate them according to the global 'evaluation_interval'. rule_files: # - "first_rules.yml" # - "second_rules.yml" # A scrape configuration containing exactly one endpoint to scrape: # Here it's Prometheus itself. scrape_configs: # The job name is added as a label `job=<job_name>` to any timeseries scraped from this config. - job_name: 'prometheus' # metrics_path defaults to '/metrics' # scheme defaults to 'http'. static_configs: - targets: ['localhost:9090'] - job_name: 'grafana' static_configs: - targets: - 'grafana-service.ns-monitor:3000' - job_name: 'kubernetes-apiservers' kubernetes_sd_configs: - role: endpoints # Default to scraping over https. If required, just disable this or change to # `http`. scheme: https # This TLS & bearer token file config is used to connect to the actual scrape # endpoints for cluster components. This is separate to discovery auth # configuration because discovery & scraping are two separate concerns in # Prometheus. The discovery auth config is automatic if Prometheus runs inside # the cluster. Otherwise, more config options have to be provided within the # <kubernetes_sd_config>. tls_config: ca_file: /var/run/secrets/kubernetes.io/serviceaccount/ca.crt # If your node certificates are self-signed or use a different CA to the # master CA, then disable certificate verification below. Note that # certificate verification is an integral part of a secure infrastructure # so this should only be disabled in a controlled environment. You can # disable certificate verification by uncommenting the line below. # # insecure_skip_verify: true bearer_token_file: /var/run/secrets/kubernetes.io/serviceaccount/token # Keep only the default/kubernetes service endpoints for the https port. This # will add targets for each API server which Kubernetes adds an endpoint to # the default/kubernetes service. relabel_configs: - source_labels: [__meta_kubernetes_namespace, __meta_kubernetes_service_name, __meta_kubernetes_endpoint_port_name] action: keep regex: default;kubernetes;https # Scrape config for nodes (kubelet). # # Rather than connecting directly to the node, the scrape is proxied though the # Kubernetes apiserver. This means it will work if Prometheus is running out of # cluster, or can't connect to nodes for some other reason (e.g. because of # firewalling). - job_name: 'kubernetes-nodes' # Default to scraping over https. If required, just disable this or change to # `http`. scheme: https # This TLS & bearer token file config is used to connect to the actual scrape # endpoints for cluster components. This is separate to discovery auth # configuration because discovery & scraping are two separate concerns in # Prometheus. The discovery auth config is automatic if Prometheus runs inside # the cluster. Otherwise, more config options have to be provided within the # <kubernetes_sd_config>. tls_config: ca_file: /var/run/secrets/kubernetes.io/serviceaccount/ca.crt bearer_token_file: /var/run/secrets/kubernetes.io/serviceaccount/token kubernetes_sd_configs: - role: node relabel_configs: - action: labelmap regex: __meta_kubernetes_node_label_(.+) - target_label: __address__ replacement: kubernetes.default.svc:443 - source_labels: [__meta_kubernetes_node_name] regex: (.+) target_label: __metrics_path__ replacement: /api/v1/nodes/${1}/proxy/metrics # Scrape config for Kubelet cAdvisor. # # This is required for Kubernetes 1.7.3 and later, where cAdvisor metrics # (those whose names begin with 'container_') have been removed from the # Kubelet metrics endpoint. This job scrapes the cAdvisor endpoint to # retrieve those metrics. # # In Kubernetes 1.7.0-1.7.2, these metrics are only exposed on the cAdvisor # HTTP endpoint; use "replacement: /api/v1/nodes/${1}:4194/proxy/metrics" # in that case (and ensure cAdvisor's HTTP server hasn't been disabled with # the --cadvisor-port=0 Kubelet flag). # # This job is not necessary and should be removed in Kubernetes 1.6 and # earlier versions, or it will cause the metrics to be scraped twice. - job_name: 'kubernetes-cadvisor' # Default to scraping over https. If required, just disable this or change to # `http`. scheme: https # This TLS & bearer token file config is used to connect to the actual scrape # endpoints for cluster components. This is separate to discovery auth # configuration because discovery & scraping are two separate concerns in # Prometheus. The discovery auth config is automatic if Prometheus runs inside # the cluster. Otherwise, more config options have to be provided within the # <kubernetes_sd_config>. tls_config: ca_file: /var/run/secrets/kubernetes.io/serviceaccount/ca.crt bearer_token_file: /var/run/secrets/kubernetes.io/serviceaccount/token kubernetes_sd_configs: - role: node relabel_configs: - action: labelmap regex: __meta_kubernetes_node_label_(.+) - target_label: __address__ replacement: kubernetes.default.svc:443 - source_labels: [__meta_kubernetes_node_name] regex: (.+) target_label: __metrics_path__ replacement: /api/v1/nodes/${1}/proxy/metrics/cadvisor # Scrape config for service endpoints. # # The relabeling allows the actual service scrape endpoint to be configured # via the following annotations: # # * `prometheus.io/scrape`: Only scrape services that have a value of `true` # * `prometheus.io/scheme`: If the metrics endpoint is secured then you will need # to set this to `https` & most likely set the `tls_config` of the scrape config. # * `prometheus.io/path`: If the metrics path is not `/metrics` override this. # * `prometheus.io/port`: If the metrics are exposed on a different port to the # service then set this appropriately. - job_name: 'kubernetes-service-endpoints' kubernetes_sd_configs: - role: endpoints relabel_configs: - source_labels: [__meta_kubernetes_service_annotation_prometheus_io_scrape] action: keep regex: true - source_labels: [__meta_kubernetes_service_annotation_prometheus_io_scheme] action: replace target_label: __scheme__ regex: (https?) - source_labels: [__meta_kubernetes_service_annotation_prometheus_io_path] action: replace target_label: __metrics_path__ regex: (.+) - source_labels: [__address__, __meta_kubernetes_service_annotation_prometheus_io_port] action: replace target_label: __address__ regex: ([^:]+)(?::\d+)?;(\d+) replacement: $1:$2 - action: labelmap regex: __meta_kubernetes_service_label_(.+) - source_labels: [__meta_kubernetes_namespace] action: replace target_label: kubernetes_namespace - source_labels: [__meta_kubernetes_service_name] action: replace target_label: kubernetes_name # Example scrape config for probing services via the Blackbox Exporter. # # The relabeling allows the actual service scrape endpoint to be configured # via the following annotations: # # * `prometheus.io/probe`: Only probe services that have a value of `true` - job_name: 'kubernetes-services' metrics_path: /probe params: module: [http_2xx] kubernetes_sd_configs: - role: service relabel_configs: - source_labels: [__meta_kubernetes_service_annotation_prometheus_io_probe] action: keep regex: true - source_labels: [__address__] target_label: __param_target - target_label: __address__ replacement: blackbox-exporter.example.com:9115 - source_labels: [__param_target] target_label: instance - action: labelmap regex: __meta_kubernetes_service_label_(.+) - source_labels: [__meta_kubernetes_namespace] target_label: kubernetes_namespace - source_labels: [__meta_kubernetes_service_name] target_label: kubernetes_name # Example scrape config for probing ingresses via the Blackbox Exporter. # # The relabeling allows the actual ingress scrape endpoint to be configured # via the following annotations: # # * `prometheus.io/probe`: Only probe services that have a value of `true` - job_name: 'kubernetes-ingresses' metrics_path: /probe params: module: [http_2xx] kubernetes_sd_configs: - role: ingress relabel_configs: - source_labels: [__meta_kubernetes_ingress_annotation_prometheus_io_probe] action: keep regex: true - source_labels: [__meta_kubernetes_ingress_scheme,__address__,__meta_kubernetes_ingress_path] regex: (.+);(.+);(.+) replacement: ${1}://${2}${3} target_label: __param_target - target_label: __address__ replacement: blackbox-exporter.example.com:9115 - source_labels: [__param_target] target_label: instance - action: labelmap regex: __meta_kubernetes_ingress_label_(.+) - source_labels: [__meta_kubernetes_namespace] target_label: kubernetes_namespace - source_labels: [__meta_kubernetes_ingress_name] target_label: kubernetes_name # Example scrape config for pods # # The relabeling allows the actual pod scrape endpoint to be configured via the # following annotations: # # * `prometheus.io/scrape`: Only scrape pods that have a value of `true` # * `prometheus.io/path`: If the metrics path is not `/metrics` override this. # * `prometheus.io/port`: Scrape the pod on the indicated port instead of the # pod's declared ports (default is a port-free target if none are declared). - job_name: 'kubernetes-pods' kubernetes_sd_configs: - role: pod relabel_configs: - source_labels: [__meta_kubernetes_pod_annotation_prometheus_io_scrape] action: keep regex: true - source_labels: [__meta_kubernetes_pod_annotation_prometheus_io_path] action: replace target_label: __metrics_path__ regex: (.+) - source_labels: [__address__, __meta_kubernetes_pod_annotation_prometheus_io_port] action: replace regex: ([^:]+)(?::\d+)?;(\d+) replacement: $1:$2 target_label: __address__ - action: labelmap regex: __meta_kubernetes_pod_label_(.+) - source_labels: [__meta_kubernetes_namespace] action: replace target_label: kubernetes_namespace - source_labels: [__meta_kubernetes_pod_name] action: replace target_label: kubernetes_pod_name---apiVersion: v1kind: ConfigMapmetadata: name: prometheus-rules namespace: ns-monitor labels: app: prometheusdata: cpu-usage.rule: | groups: - name: NodeCPUUsage rules: - alert: NodeCPUUsage expr: (100 - (avg by (instance) (irate(node_cpu{name="node-exporter",mode="idle"}[5m])) * 100)) > 75 for: 2m labels: severity: "page" annotations: summary: "{{$labels.instance}}: High CPU usage detected" description: "{{$labels.instance}}: CPU usage is above 75% (current value is: {{ $value }})"---apiVersion: v1kind: PersistentVolumemetadata: name: "prometheus-data-pv" labels: name: prometheus-data-pv release: stablespec: capacity: storage: 5Gi accessModes: - ReadWriteOnce persistentVolumeReclaimPolicy: Recycle nfs: path: /nfs/data/prometheus server: 121.41.10.13---apiVersion: v1kind: PersistentVolumeClaimmetadata: name: prometheus-data-pvc namespace: ns-monitorspec: accessModes: - ReadWriteOnce resources: requests: storage: 5Gi selector: matchLabels: name: prometheus-data-pv release: stable---kind: DeploymentapiVersion: apps/v1beta2metadata: labels: app: prometheus name: prometheus namespace: ns-monitorspec: replicas: 1 revisionHistoryLimit: 10 selector: matchLabels: app: prometheus template: metadata: labels: app: prometheus spec: serviceAccountName: prometheus securityContext: runAsUser: 0 containers: - name: prometheus image: prom/prometheus:latest imagePullPolicy: IfNotPresent volumeMounts: - mountPath: /prometheus name: prometheus-data-volume - mountPath: /etc/prometheus/prometheus.yml name: prometheus-conf-volume subPath: prometheus.yml - mountPath: /etc/prometheus/rules name: prometheus-rules-volume ports: - containerPort: 9090 protocol: TCP volumes: - name: prometheus-data-volume persistentVolumeClaim: claimName: prometheus-data-pvc - name: prometheus-conf-volume configMap: name: prometheus-conf - name: prometheus-rules-volume configMap: name: prometheus-rules tolerations: - key: node-role.kubernetes.io/master effect: NoSchedule---kind: ServiceapiVersion: v1metadata: annotations: prometheus.io/scrape: 'true' labels: app: prometheus name: prometheus-service namespace: ns-monitorspec: ports: - port: 9090 targetPort: 9090 selector: app: prometheus type: NodePort
apiVersion: v1kind: PersistentVolumemetadata: name: "grafana-data-pv" labels: name: grafana-data-pv release: stablespec: capacity: storage: 5Gi accessModes: - ReadWriteOnce persistentVolumeReclaimPolicy: Recycle nfs: path: /nfs/data/grafana server: 121.41.10.13---apiVersion: v1kind: PersistentVolumeClaimmetadata: name: grafana-data-pvc namespace: ns-monitorspec: accessModes: - ReadWriteOnce resources: requests: storage: 5Gi selector: matchLabels: name: grafana-data-pv release: stable---kind: DeploymentapiVersion: apps/v1beta2metadata: labels: app: grafana name: grafana namespace: ns-monitorspec: replicas: 1 revisionHistoryLimit: 10 selector: matchLabels: app: grafana template: metadata: labels: app: grafana spec: securityContext: runAsUser: 0 containers: - name: grafana image: grafana/grafana:latest imagePullPolicy: IfNotPresent env: - name: GF_AUTH_BASIC_ENABLED value: "true" - name: GF_AUTH_ANONYMOUS_ENABLED value: "false" readinessProbe: httpGet: path: /login port: 3000 volumeMounts: - mountPath: /var/lib/grafana name: grafana-data-volume ports: - containerPort: 3000 protocol: TCP volumes: - name: grafana-data-volume persistentVolumeClaim: claimName: grafana-data-pvc---kind: ServiceapiVersion: v1metadata: labels: app: grafana name: grafana-service namespace: ns-monitorspec: ports: - port: 3000 targetPort: 3000 selector: app: grafana type: NodePort
#ingressapiVersion: extensions/v1beta1kind: Ingressmetadata: name: ingress namespace: ns-monitorspec: rules: - host: monitor.k8s.ghy.com http: paths: - path: / backend: serviceName: grafana-service servicePort: 3000
(2)创建命名空间ns-monitor
kubectl apply -f namespace.yaml
kubectl get namespace
(3)创建node-exporter
kubectl apply -f node-exporter.yaml
kubectl get pod -n ns-monitor kubectl get svc -n ns-monitor
kubectl get ds -n ns-monitor
kubectl apply -f prometheus.yaml
kubectl get pod -n ns-monitor
kubectl get svc -n ns-monitor
kubectl apply -f grafana.yaml
kubectl get pod -n ns-monitor
kubectl get svc -n ns-monitor
kubectl apply - ingress.yaml
kubectl get ingress -n ns-monitor
kubectl describe ingress -n ns-monitor