为什么要做测试右移?
测试右移主要实践:

为什么要搭建监控系统:
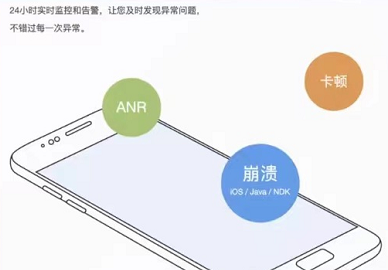
质量监控:
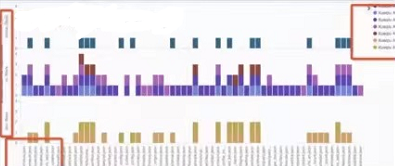
测试监控:
ELK Stack 代指 Elasticsearch、Logstash 和 Kibana ,在这个生态圈慢慢发展过程中,加入了一个新成员 Beats。
ElasticSearch:基于 Java,一个开源的分布式搜索引擎。
LogStash:基于 Java,开源的用于收集、分析和存储日志的工具。(它和 Beats 有重叠的功能。Beats 出现之后,LogStash 则专门做日志的分析)
Kibana:基于 Node.js,主要为 ElasticSearch 和 LogStash 提供 Web 页面展示,可以汇总,分析搜索信息。
Beats:数据采集,它其实是一个综合的名字,它由一些子项目组合而成。

docker pull docker.elastic.co/elasticsearch/elasticsearch:8.1.2docker pull docker.elastic.co/kibana/kibana:8.1.2docker pull docker.elastic.co/logstash/logstash:8.1.2Running the Elastic Stack ("ELK") on Docker | Getting Started [8.1] | Elastic
简体中文 | Elastic
# 创建子网docker create network elastic# 启动 elasticsearch 容器docker run -d --name es01 --net elastic -p 9200:9200 docker.elastic.co/elasticsearch/elasticsearch:8.1.2# 由于启动时间较久,可使用 docker logs -f es01 查看启动日志记录启动日志中的登录密码及 Token(注意有效期为半小时):

-> Password for the elastic user (reset with `bin/elasticsearch-reset-password -u elastic`): DB1ngqLjym5Zg3n-doni-> HTTP CA certificate SHA-256 fingerprint: 2cffe4439402214dcd28786c835fcd9fdce82f266a8cfd915cdd9fd52facdea3-> Configure Kibana to use this cluster:* Run Kibana and click the configuration link in the terminal when Kibana starts.* Copy the following enrollment token and paste it into Kibana in your browser (valid for the next 30 minutes): eyJ2ZXIiOiI4LjEuMiIsImFkciI6WyIxNzIuMTkuMC4yOjkyMDAiXSwiZmdyIjoiMmNmZmU0NDM5NDAyMjE0ZGNkMjg3ODZjODM1ZmNkOWZkY2U4MmYyNjZhOGNmZDkxNWNkZDlmZDUyZmFjZGVhMyIsImtleSI6InZ5UkZySUVCYzFJYTJ4eXZWUXRLOlJSYW03X1FnU3ZxdUZqT0lnOEZLTUEifQ==-> Configure other nodes to join this cluster:* Copy the following enrollment token and start new Elasticsearch nodes with `bin/elasticsearch --enrollment-token <token>` (valid for the next 30 minutes): eyJ2ZXIiOiI4LjEuMiIsImFkciI6WyIxNzIuMTkuMC4yOjkyMDAiXSwiZmdyIjoiMmNmZmU0NDM5NDAyMjE0ZGNkMjg3ODZjODM1ZmNkOWZkY2U4MmYyNjZhOGNmZDkxNWNkZDlmZDUyZmFjZGVhMyIsImtleSI6IndTUkZySUVCYzFJYTJ4eXZWUXVsOlF0bFNtVnVCVFhXVV83UThUcVZETkEifQ== If you're running in Docker, copy the enrollment token and run: `docker run -e "ENROLLMENT_TOKEN=<token>" docker.elastic.co/elasticsearch/elasticsearch:8.1.2`证书认证:
# 拷贝证书到本地docker cp es01:/usr/share/elasticsearch/config/certs/http_ca.crt .# 进行认证curl --cacert http_ca.crt -u elastic https://localhost:9200# 输入刚刚记录下的密码
启动 Kibana:
docker run -d \ --name kibana \ --link elasticsearch:elasticsearch \ --net elastic \ -p 5601:5601 \ docker.elastic.co/kibana/kibana:8.1.2
输入 ES 启动日志中的 Token 及 Kibana 启动日志中的 code:
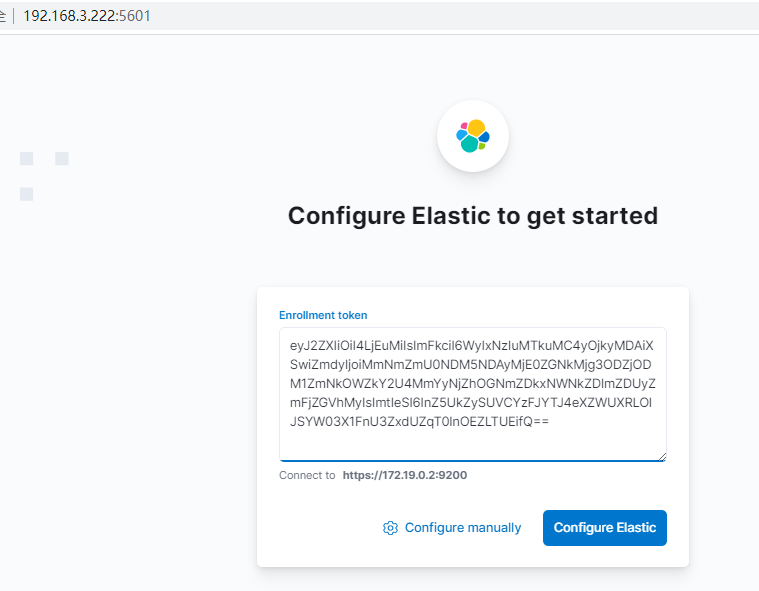
输入 ES 启动日志中的用户名/密码:

示例:使用 ES 提供的集成工具(Nginx Agent),自动采集服务器上的 Nginx 日志数据到 ES 中

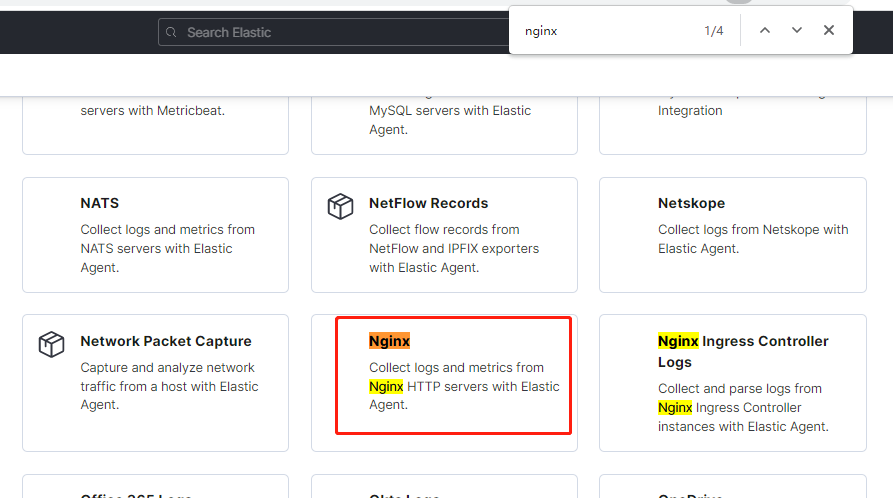
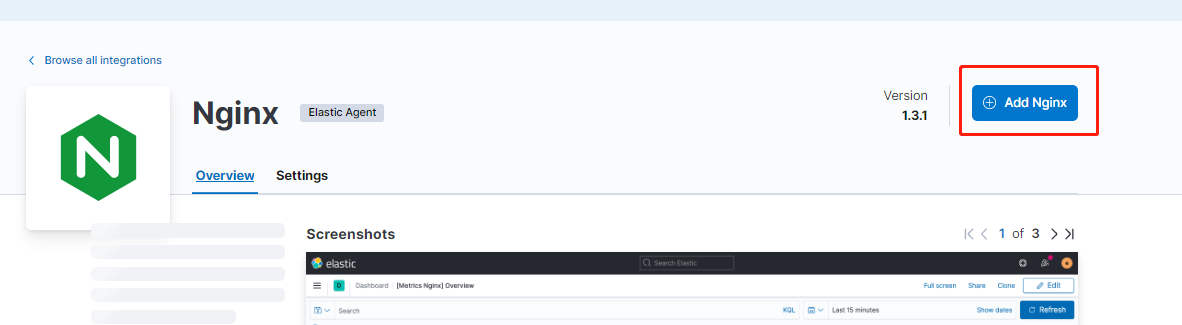
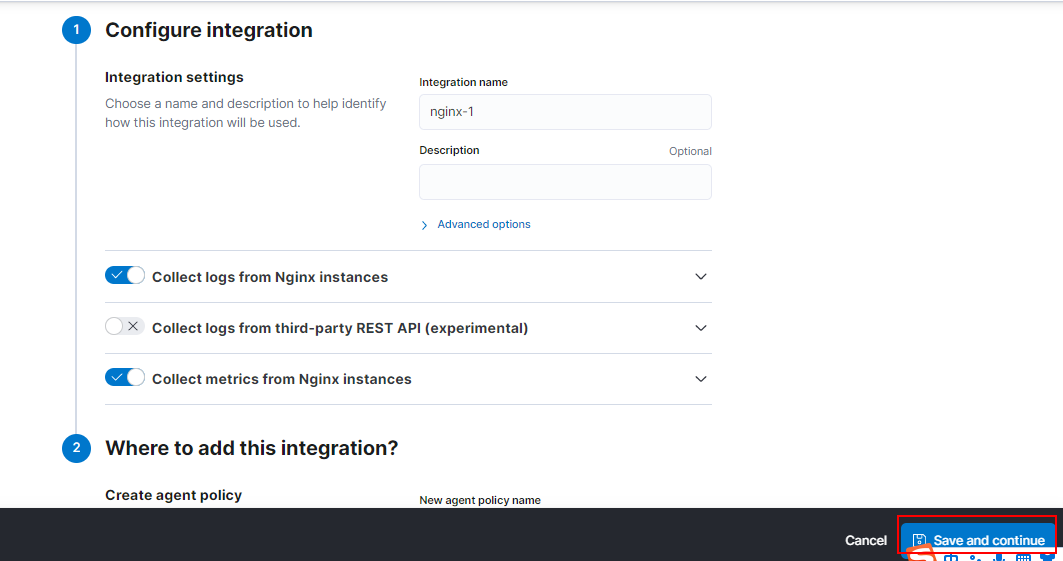
使用默认配置进行保存:
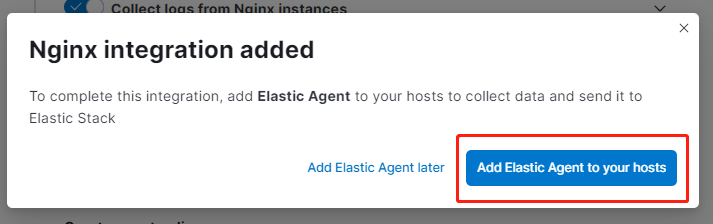
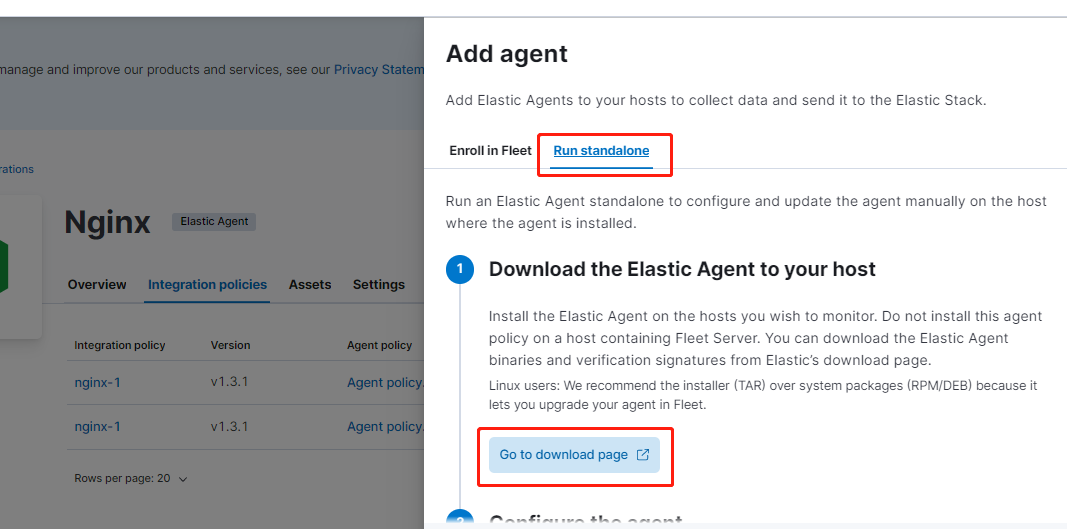

将上述 ES 提供的日志采集 Agent 下载到 Nginx 服务器中:
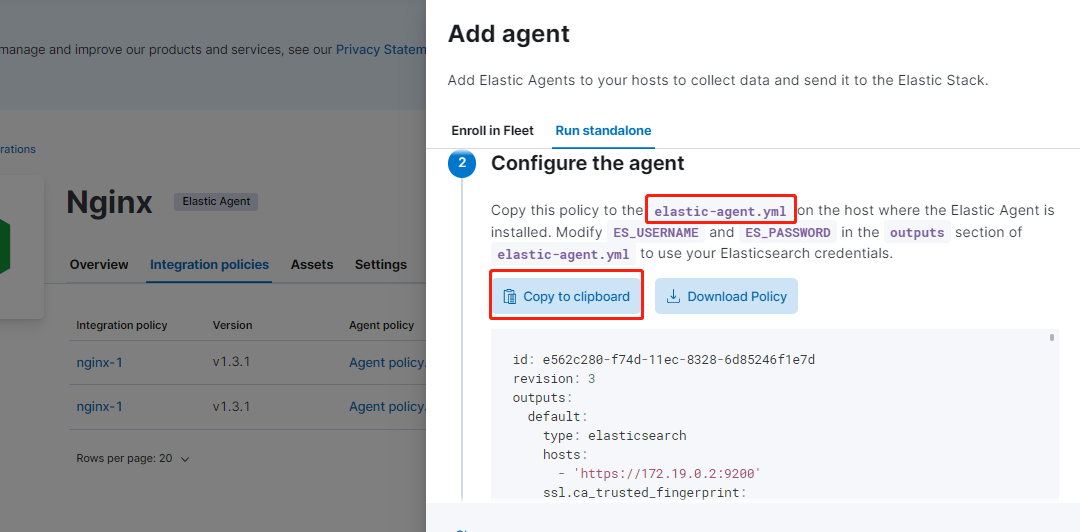
[root@localhost es_agent]# wget https://artifacts.elastic.co/downloads/beats/elastic-agent/elastic-agent-8.1.2-linux-x86_64.tar.gz创建 elastic-agent.yml 配置文件:
解压 agent 并执行:
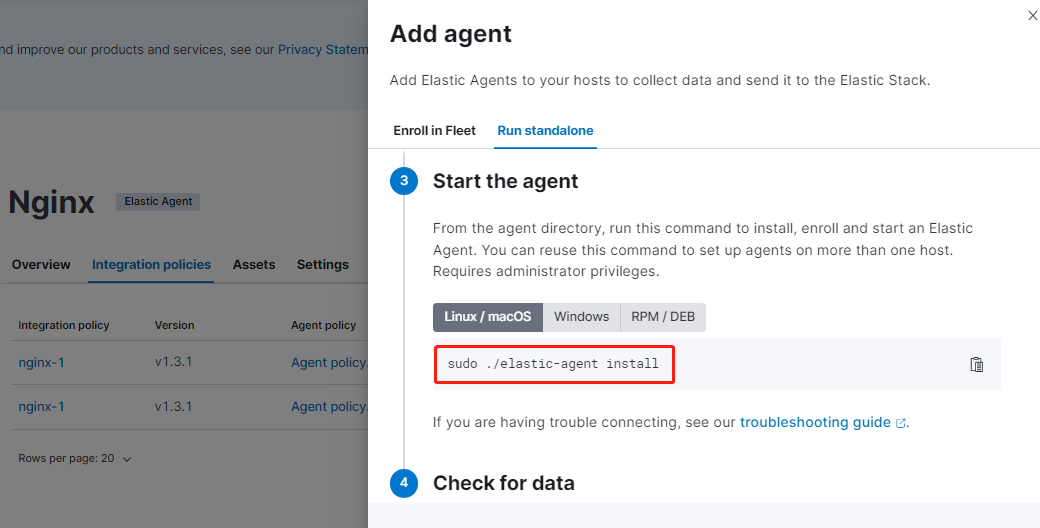
[root@localhost es_agent]# tar -zxvf elastic-agent-8.1.2-linux-x86_64.tar.gz...[root@localhost es_agent]# lselastic-agent-8.1.2-linux-x86_64 elastic-agent-8.1.2-linux-x86_64.tar.gz elastic-agent.yml[root@localhost es_agent]# ./elastic-agent-8.1.2-linux-x86_64/elastic-agent installElastic Agent will be installed at /opt/Elastic/Agent and will run as a service. Do you want to continue? [Y/n]:yDo you want to enroll this Agent into Fleet? [Y/n]:nElastic Agent has been successfully installed.# 此时 agent 会被成功安装在 /opt/Elastic/Agent/ 目录替换刚下载的配置文件:
[root@localhost Agent]# mv elastic-agent.yml elastic-agent.yml_bak[root@localhost Agent]# mv ../elastic-agent.yml .[root@localhost Agent]# vi elastic-agent.yml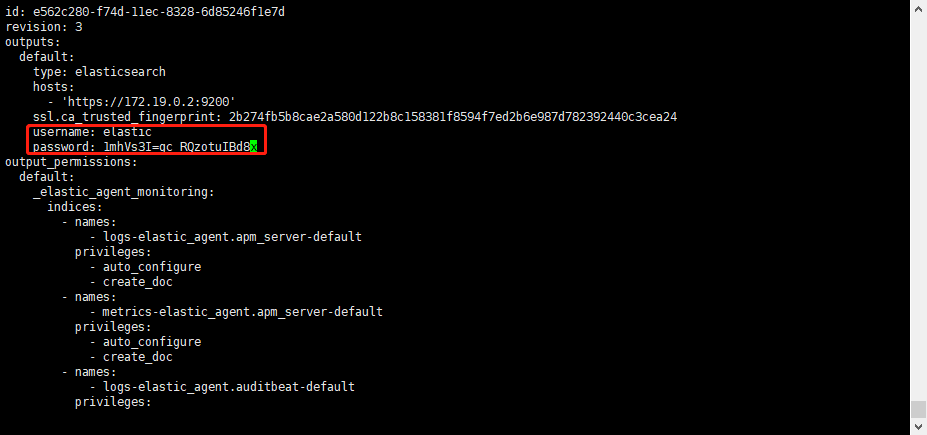
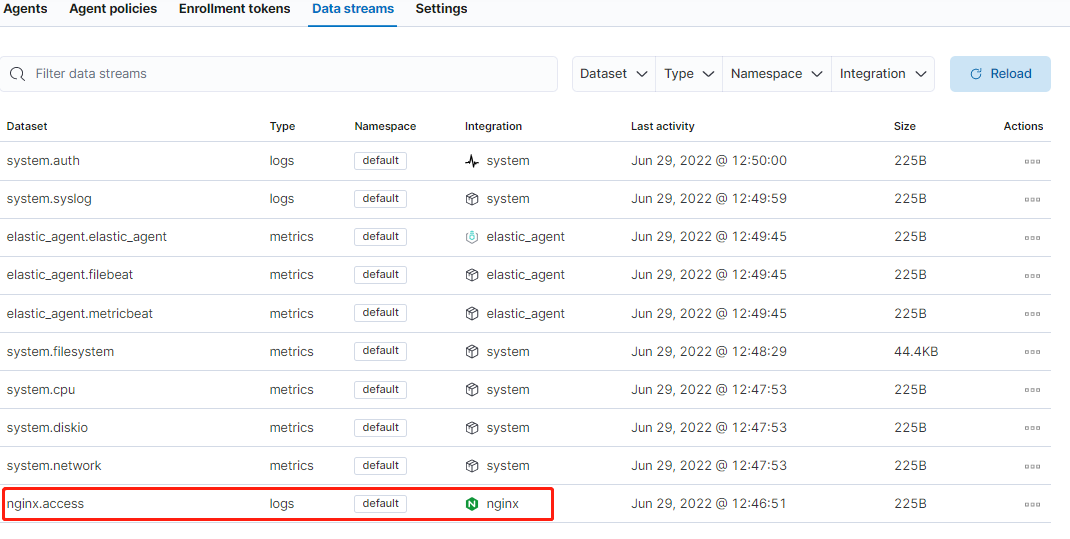
# 重启 agent[root@localhost Agent]# ./elastic-agent restart# 下载 nginx[root@localhost Agent]# yum install nginx# 启动 nginx[root@localhost Agent]# systemctl start nginx# 查看 nginx 日志,发现已被 agent 监控[root@localhost Agent]# less /var/log/nginx/access.log127.0.0.1 - - [29/Jun/2022:12:42:23 +0800] "GET /nginx_status HTTP/1.1" 404 3971 "-" "Elastic-Metricbeat/8.1.2 (linux; amd64; 6118f25235a52a7f0c4937a0a309e380c92d8119; 2022-03-29 22:45:47 +0000 UTC)" "-"127.0.0.1 - - [29/Jun/2022:12:42:40 +0800] "GET /nginx_status HTTP/1.1" 404 3971 "-" "Elastic-Metricbeat/8.1.2 (linux; amd64; 6118f25235a52a7f0c4937a0a309e380c92d8119; 2022-03-29 22:45:47 +0000 UTC)" "-"...确认日志数据正常被采集到 ES 中:

创建自定义视图(正则匹配所需要的日志文件):
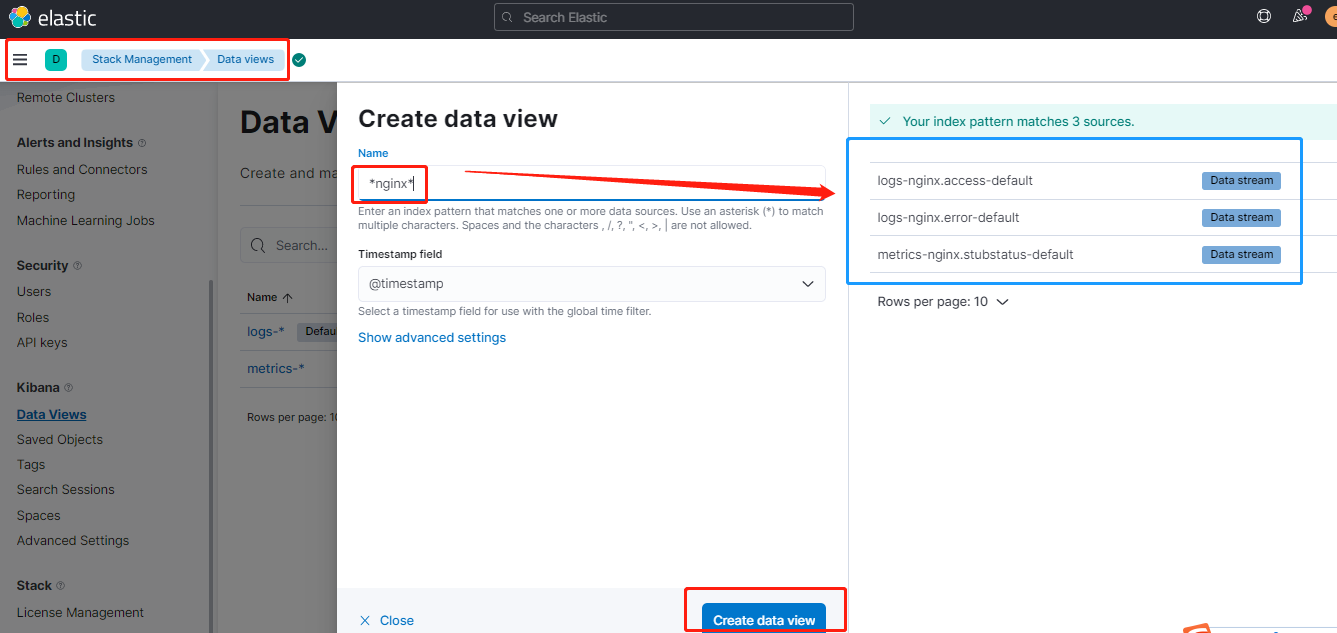
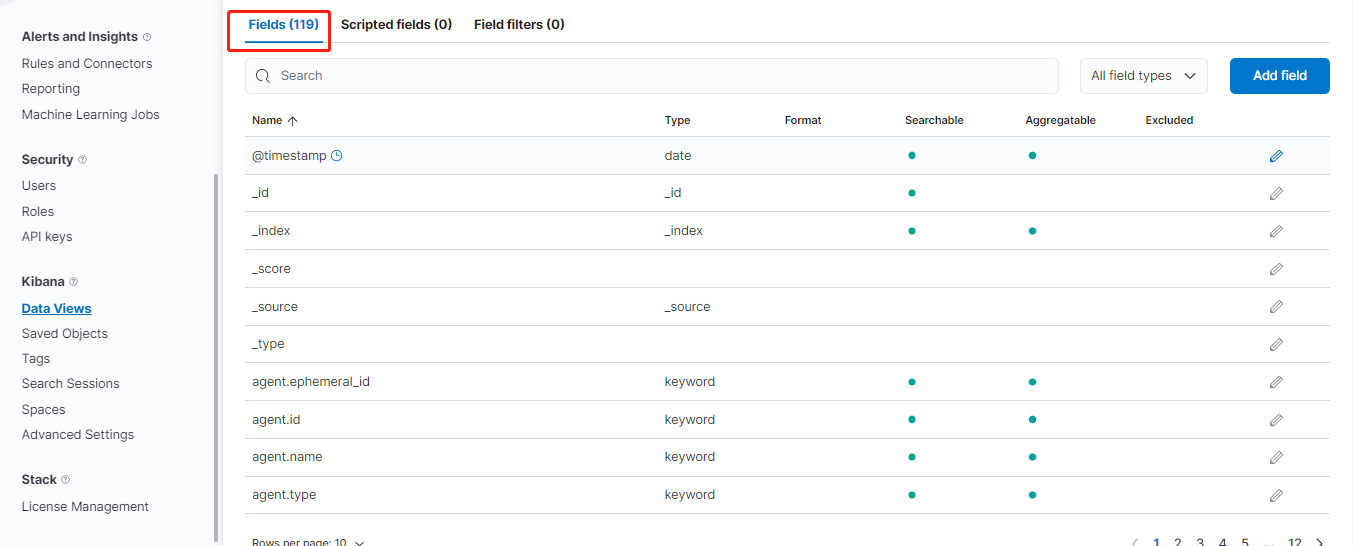
创建完成后,会自动解析字段:
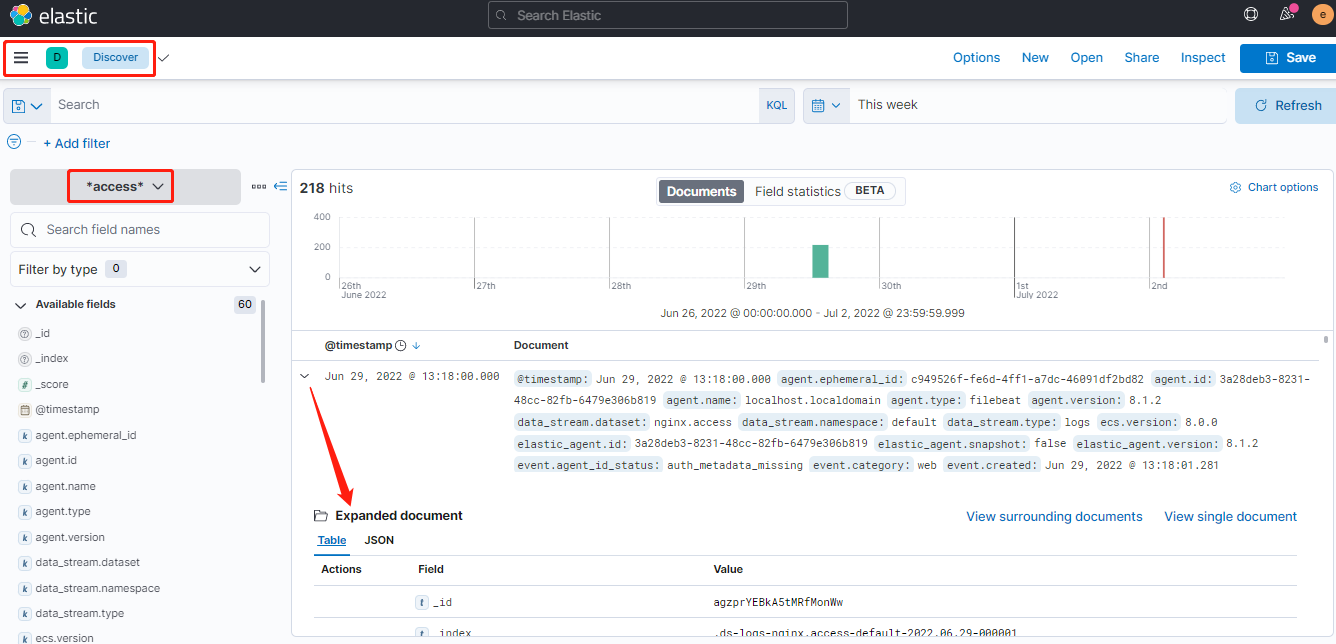
查看自定义视图的统计图及明细数据:
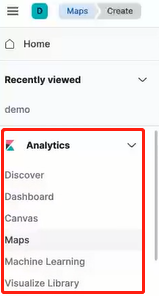
更多的数据分析功能:
Configuring Logstash for Docker
Logstash configuration examples
配置文件:vi $PWD/pipeline/logstash.conf
# 输入input { file { path => [ "/data/*.log" ] # logstash的data目录下的log }}# 过滤filter { grok { match => { "message" => ["%{IPORHOST:[nginx][access][remote_ip]} - %{DATA:[nginx][access][user_name]} \[%{HTTPDATE:[nginx][access][time]}\] \"%{WORD:[nginx][access][method]} %{DATA:[nginx][access][url]} HTTP/%{NUMBER:[nginx][access][http_version]}\" %{NUMBER:[nginx][access][response_code]} %{NUMBER:[nginx][access][body_sent][bytes]} \"%{DATA:[nginx][access][referrer]}\" \"%{DATA:[nginx][access][agent]}\""] } remove_field => "message" }}# 输出output { stdout {} # 标准输出 elasticsearch { # 输出到 es hosts => ["https://192.168.3.222:9200"] # es主机 index => "logstash-nginx-%{+YYYY.MM.dd}" # 生成的索引 user => "elastic" # es用户名 password => "-yAoRIIni3qy*RW*Q8Nc" # es密码 ssl_certificate_verification => false # 关闭es证书认证 }}启动 logstash:
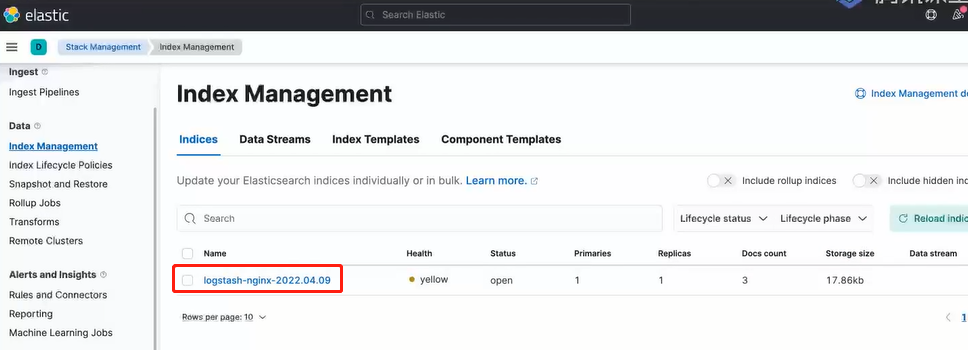
# 配置文件[root@localhost logstash]# vi logstash.ymlhttp.host: "0.0.0.0"xpack.monitoring.elasticsearch.hosts: ["https://192.168.3.222:9200"]xpack.monitoring.elasticsearch.username: "elastic"xpack.monitoring.elasticsearch.password: "-yAoRIIni3qy*RW*Q8Nc"xpack.monitoring.enabled: true# 启动 logstashdocker run --name logstash --rm -d --net elastic \ -v $PWD/logstash.yml:/usr/share/logstash/config/logstash.yml \ # 挂载配置文件 -v $PWD/pipeline:/usr/share/logstash/pipeline/ \ # 挂载采集配置文件目录 -v /var/log/nginx/access.log:/data/access.log \ # 挂载nginx的访问日志 -v /var/log/nginx/error.log:/data/error.log \ # 挂载nginx的错误日志 docker.elastic.co/logstash/logstash:8.1.2 \ --config.reload.automatic # 热更新配置文件查看成功生成的索引:
接着便可创建自定义视图(data view)并进行数据分析。