logistic回归,是一个分类算法,可以处理二元分类,多元分类。我们使用sklearn中的logistic对手写数字识别进行实践。
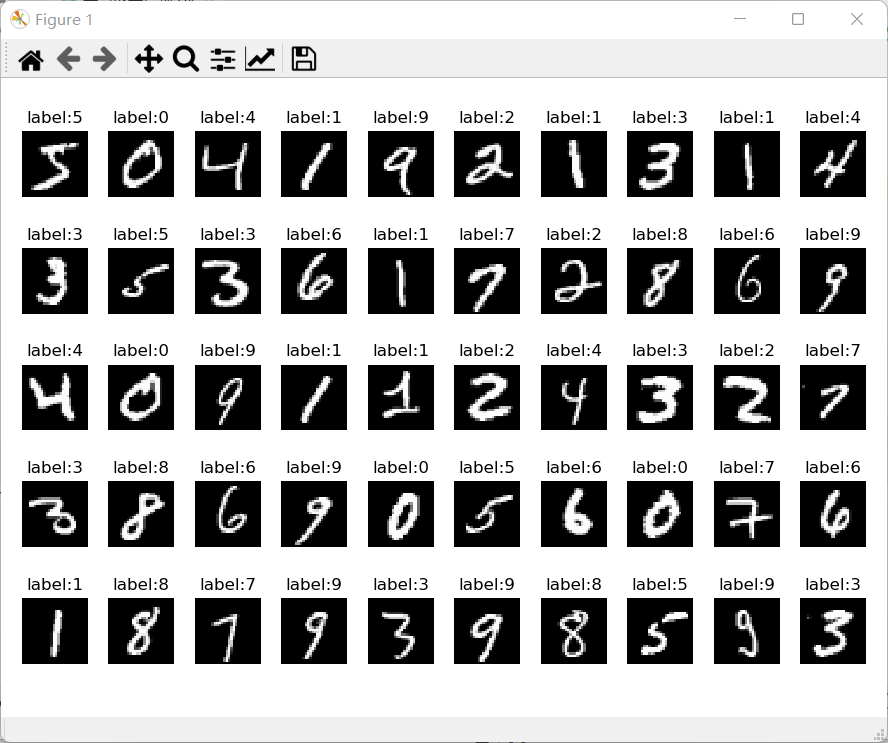
MNIST数据集来自美国国家标准与技术研究所,训练集由250个不同人手写数字构成,50%高中学生,50%来自人口普查局。
百度云盘:
链接:https://pan.baidu.com/s/1ZBU8XBsx7lp7gdN4ySSIWg
提取码:5mrf
pycharm默认会在右边进行绘图,由于某些原因导致图片不能显示,只能是白图的解决办法。
我们可以首先把图片显示调到独立画框显示。file->settings->Tools->Python Scientific 取消勾选 show plots in tool window.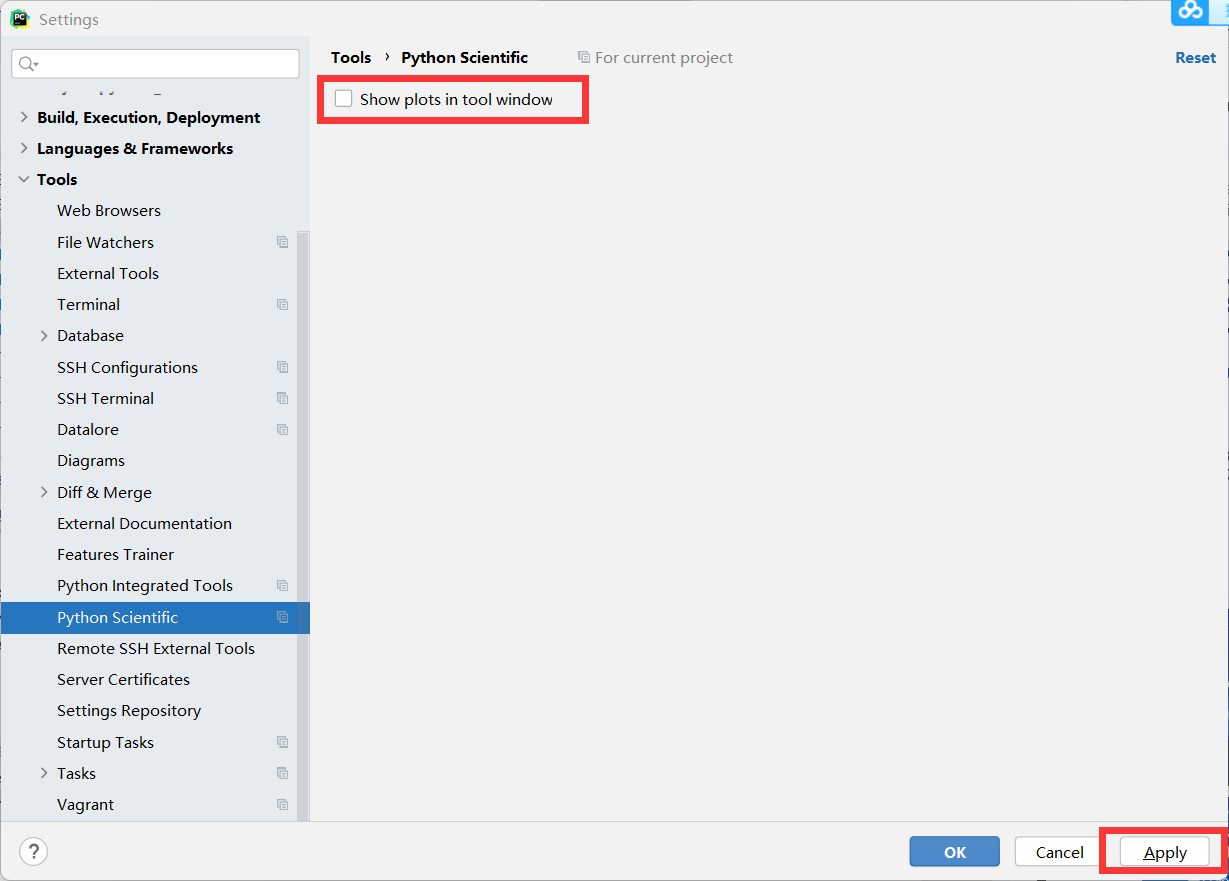
进行上述操作之后会独立弹出画框进行画图,如果仍然不能显示可以进行下面操作。
找到Configure subplots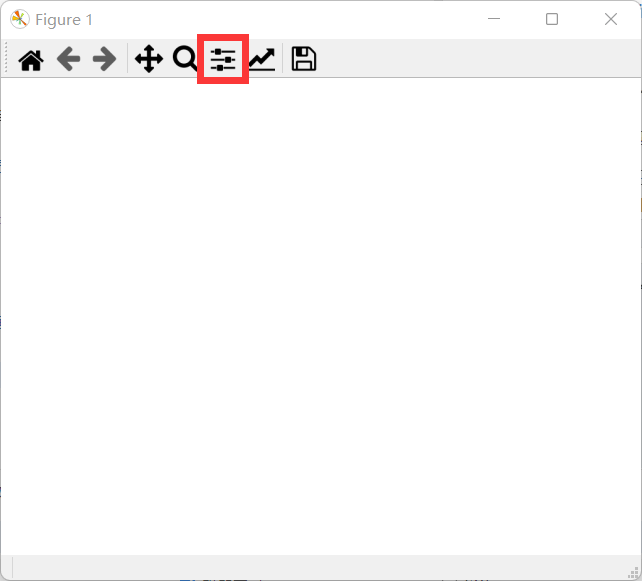
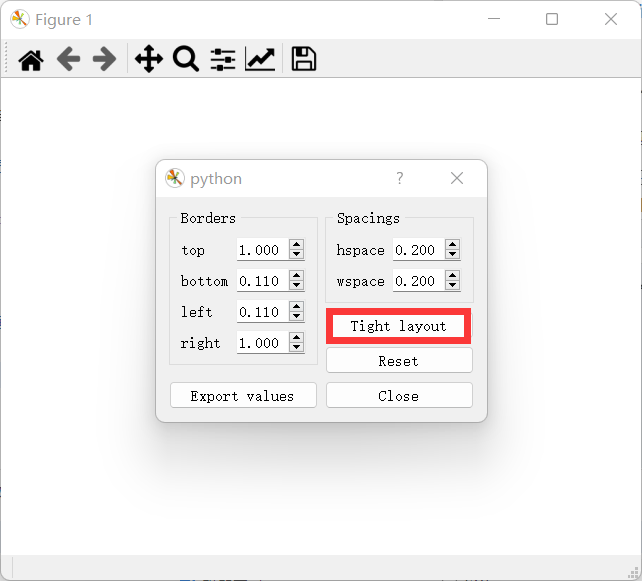
点击紧凑布局,就能显示,之前不能显示可能是因为图太大,导致我们没有看到。
## logistis回归,是一个分类算法,可以处理二元分类,多元分类。## 首先逻辑回归构造冠以的线性回归函数,然后使用sigmoid函数将回归值映射到散列类别## sklearn 分类算法与手写数字识别## 数据介绍## MNIST数据集来自美国国家标准与技术研究所,训练集由250个不同人手写数字构成,50%高中学生,50%来自人口普查局## 导包import struct,osimport numpy as npfrom array import array as pyarrayfrom numpy import append,array,int8,uint8,zerosimport matplotlib.pyplot as pltfrom sklearn.metrics import accuracy_score, classification_reportfrom sklearn.linear_model import LogisticRegression## 加载数据集def load_mnist(image_file,label_file,path="mnist"): digits=np.arange(10) fname_image = os.path.join(path,image_file) fname_label = os.path.join(path, label_file) flbl = open(fname_label,'rb') magic_nr, size = struct.unpack(">II", flbl.read(8)) lbl = pyarray("b",flbl.read()) flbl.close() fimg = open(fname_image,'rb') magic_nr, size, rows, cols = struct.unpack(">IIII", fimg.read(16)) img = pyarray("B",fimg.read()) fimg.close() ind = [ k for k in range(size) if lbl[k] in digits ] N = len(ind) images = zeros((N, rows*cols),dtype = uint8) labels = zeros((N,1), dtype = int8) for i in range(len(ind)): images[i] = array(img[ind[i]*rows*cols : (ind[i]+1)*rows*cols]).reshape((1,rows*cols)) labels[i] = lbl[ind[i]] return images,labelstrain_image, train_label = load_mnist('train-images.idx3-ubyte', 'train-labels.idx1-ubyte')test_image, test_label = load_mnist('t10k-images.idx3-ubyte','t10k-labels.idx1-ubyte')## 数据展示## 28*28def show_image(imgdata, imgtarget, show_column, show_row,titlename): for index, (im, it) in enumerate(list(zip(imgdata, imgtarget))): xx = im.reshape(28,28) plt.subplots_adjust(left=1, bottom=None, right=3,top=2, wspace=None, hspace=None) plt.subplot(show_row,show_column,index+1) plt.axis('off') plt.imshow(xx, cmap='gray', interpolation='nearest') plt.title(titlename+':%i' % it) # plt.savefig(titlename+'.png') # 这个地方可能会有一个警告,可能因为图太大了,不过没关系,代码正常运行 plt.show()show_image(train_image[:50], train_label[:50],10,5,'label')## sklearn 分类模型## 数据归一化train_image = [im/255.0 for im in train_image]test_image = [im/255.0 for im in test_image]print(len(train_image))print(len(test_image))print(len(train_label))print(len(test_label))## 模型分类## 模型实例化lr = LogisticRegression(max_iter=1000)## 模型训练lr.fit(train_image,train_label.ravel())## 模型验证predict = lr.predict(test_image)print("accuracy score: %.4lf"% accuracy_score(predict,test_label))print("classfication report for %s:\n%s\n"%(lr, classification_report(test_label, predict)))show_image(test_image[:100],predict,10,10,'predict')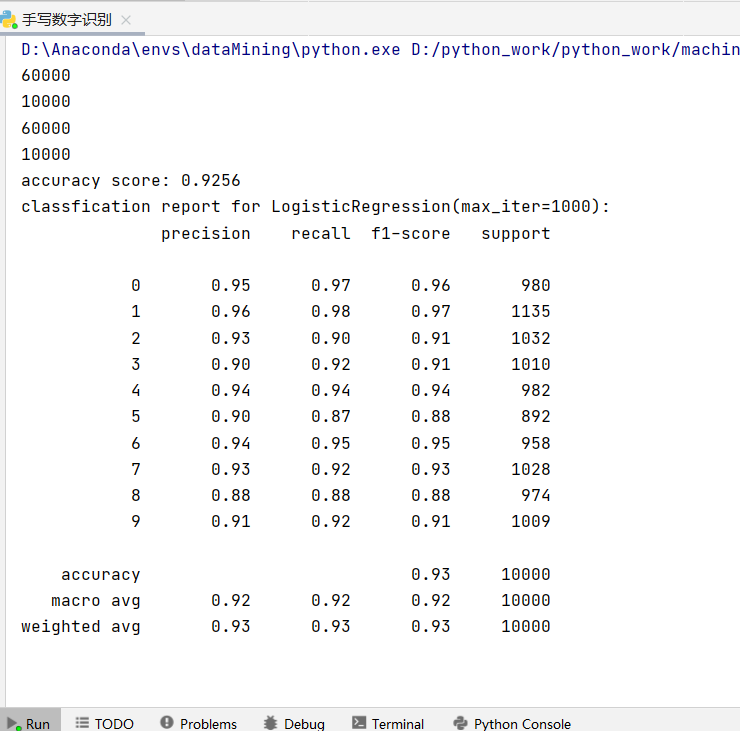
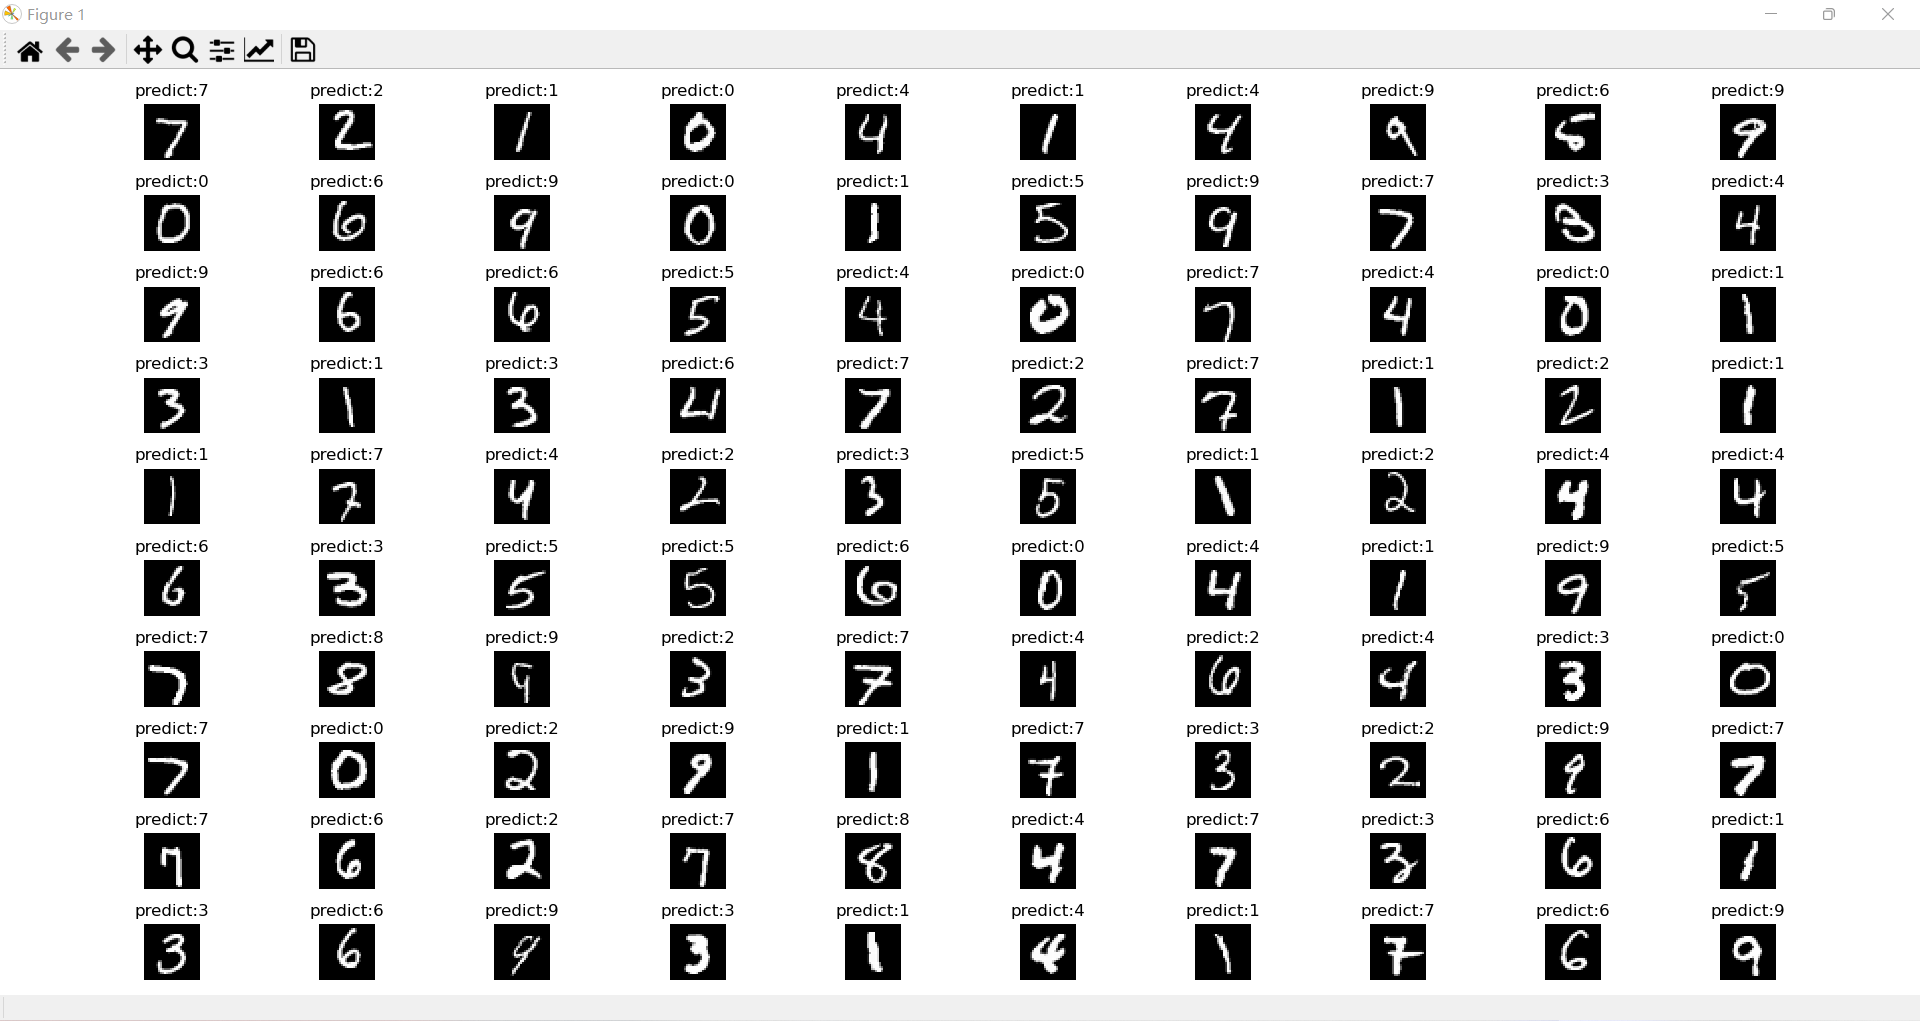
我们展示了100张图片的识别效果,可以找到3张明显的识别错误,和模型的评估结果相似。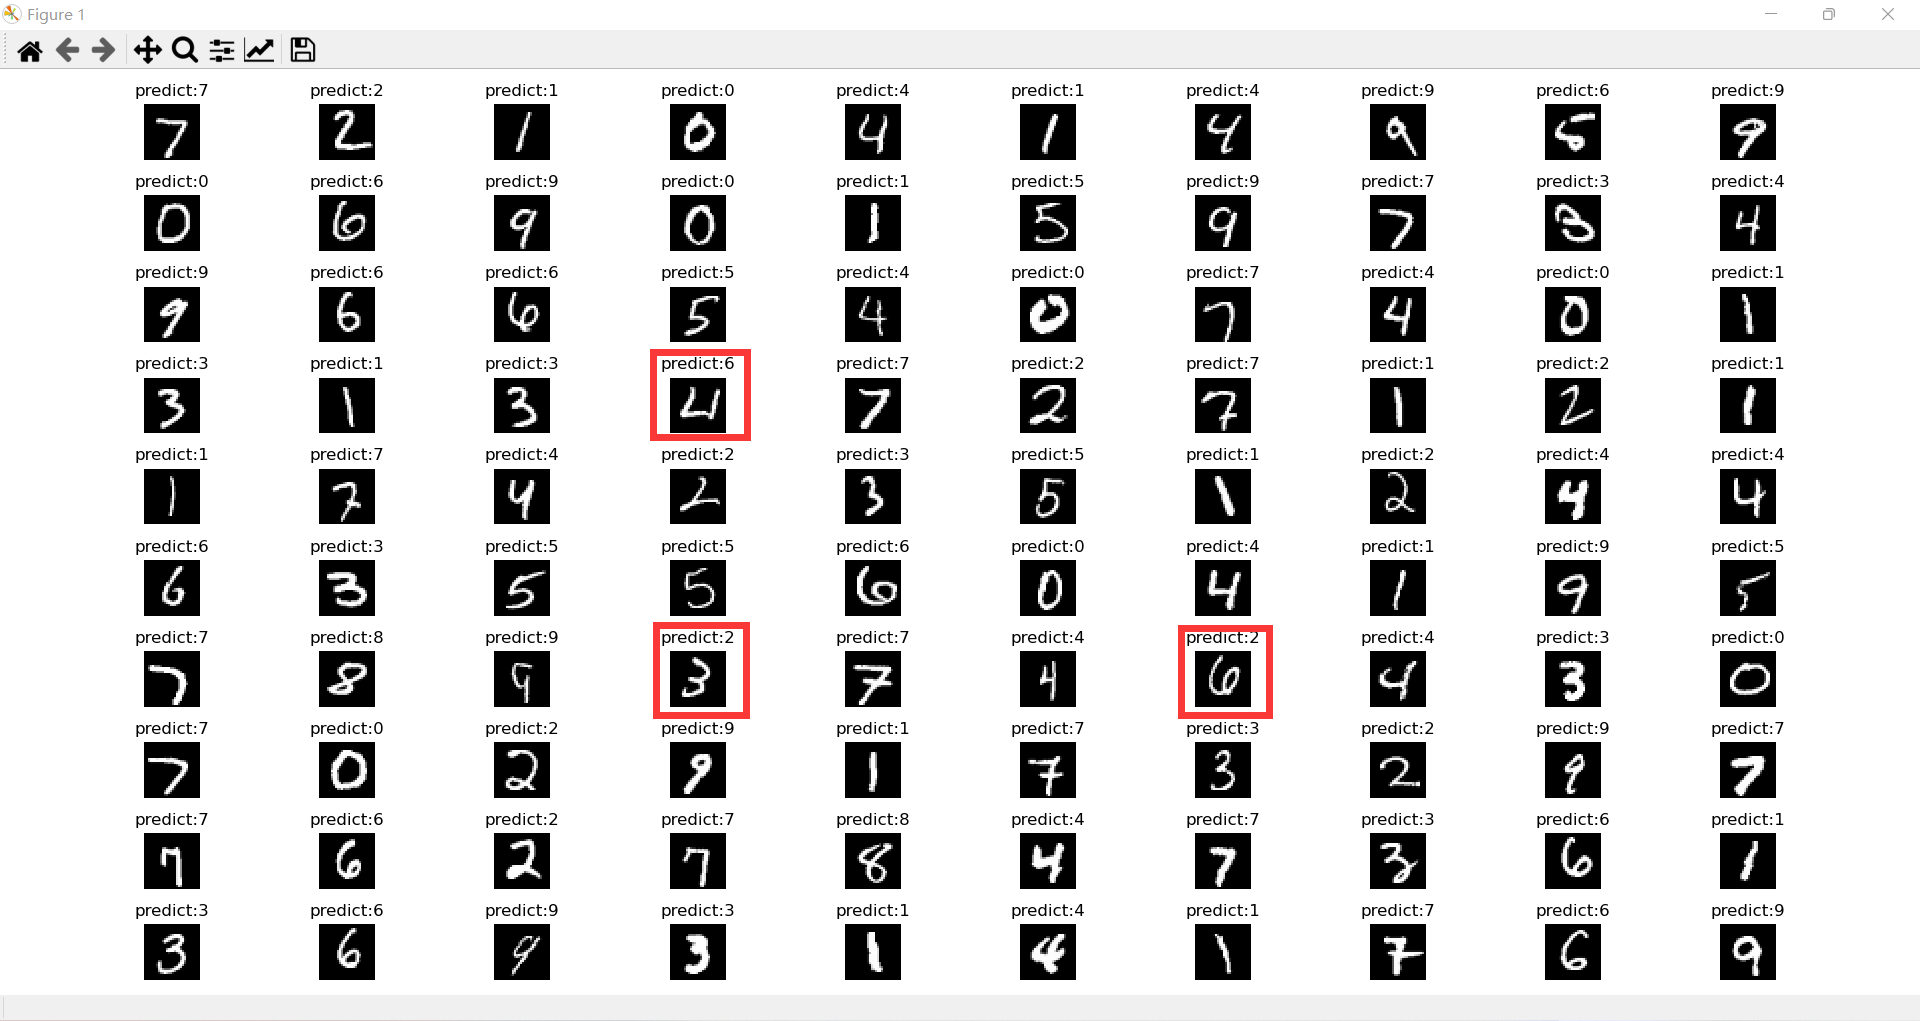
我们可以多重复运行几次发现结果并没有变化,这可能也是logistic回归的缺点吧,我们也可以使用神经网络进行手写数字识别,但那是深度学习的内容,我们后续会对其进行实现。